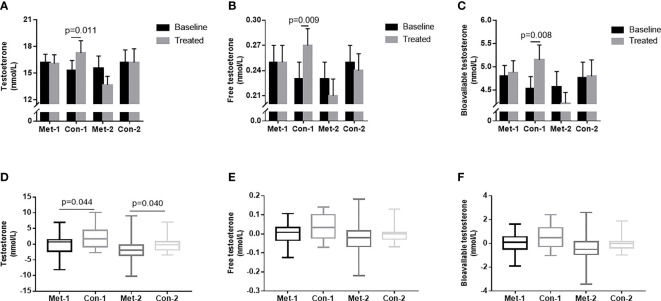
Figure 3.
(A–C) TT, FT and Bio-T levels at baseline and endpoint in metformin and control groups under different stratification. (D–F) the changes of TT, FT and Bio-T levels between metformin and control group before and after treatment under different stratification. 1=△GA ≤ 0; 2 =△GA>0; Data are mean ± SE.

