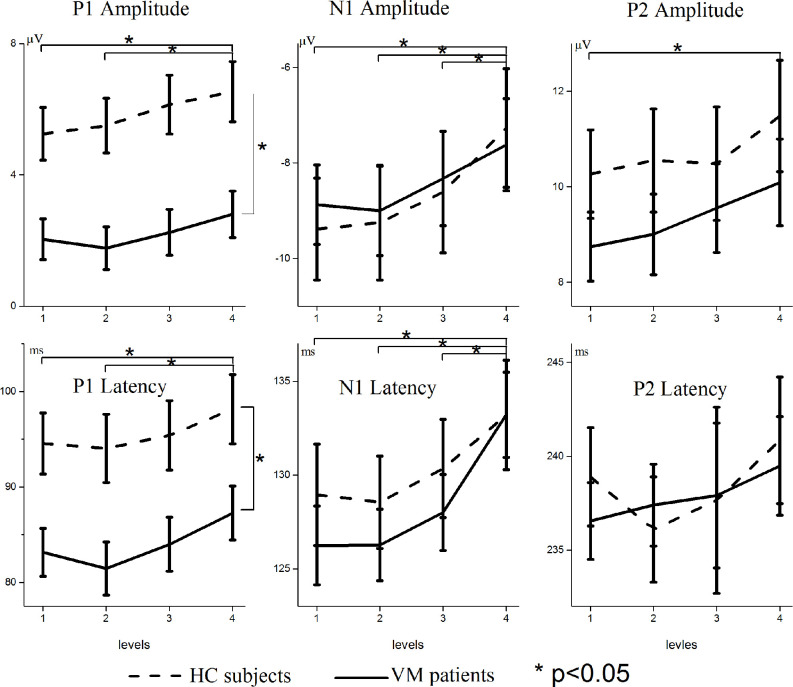
Figure 2.
Modulation of scalp-recorded VEPs across different luminance ratios. The amplitudes and latencies of the P1, N1, and P2 VEPs are shown separately for VM patients (solid line) and HC subjects (dashed line). Levels 1 and 4 refer to the smallest (12.5%) and largest (50%) proportions of white pixels in the stimulus pattern, respectively. Asterisks indicate significant differences between VM patients and HC subjects (p < 0.05). Note the different scaling for different VEP components.

