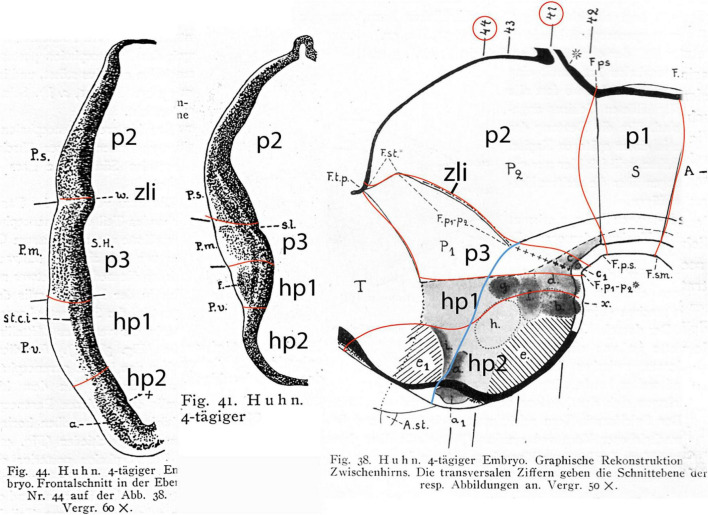
FIGURE 5.
Drawings extracted from Rendahl (1924), showing his reconstructed neuromeric model of the chick diencephalon at 4 days of incubation and histological details in two cross-sections. I added the red lines and the large labels p2, p3, hp1, hp2 to show comparatively where we place in our present updated model the neuromeric boundaries, largely coinciding with Rendahl. The p1 alar domain corresponds to the pretectum, whereas p2 and p3 mark the thalamus and prethalamus alar domains, respectively (note the neuromeres are wedge-shaped because they are deformed by the axial cephalic flexure). The p2/p3 boundary is the zona limitans intrathalamica, first defined by Rendahl, although it had been depicted by Tello (Tello, 1923; number 8 in the right part of Figure 2). The hp1 and hp2 domains are the two hypothalamo-telencephalic prosomeres postulated by us in the updated prosomeric model. The two cross-sections at left correspond to the section levels marked in the map as 44 and 41. They illustrate the differential histogenetic patterns and the abrupt boundaries corresponding to the interneuromeric borders, even within the hypothalamus, where Rendahl did not postulate neuromeres. He only represented the longitudinal sulcus limitans at p1 and p2, separating their alar and basal portions. We extend this landmark through p3 and the hypothalamus as well, ending under the optic chiasma (blue line).

