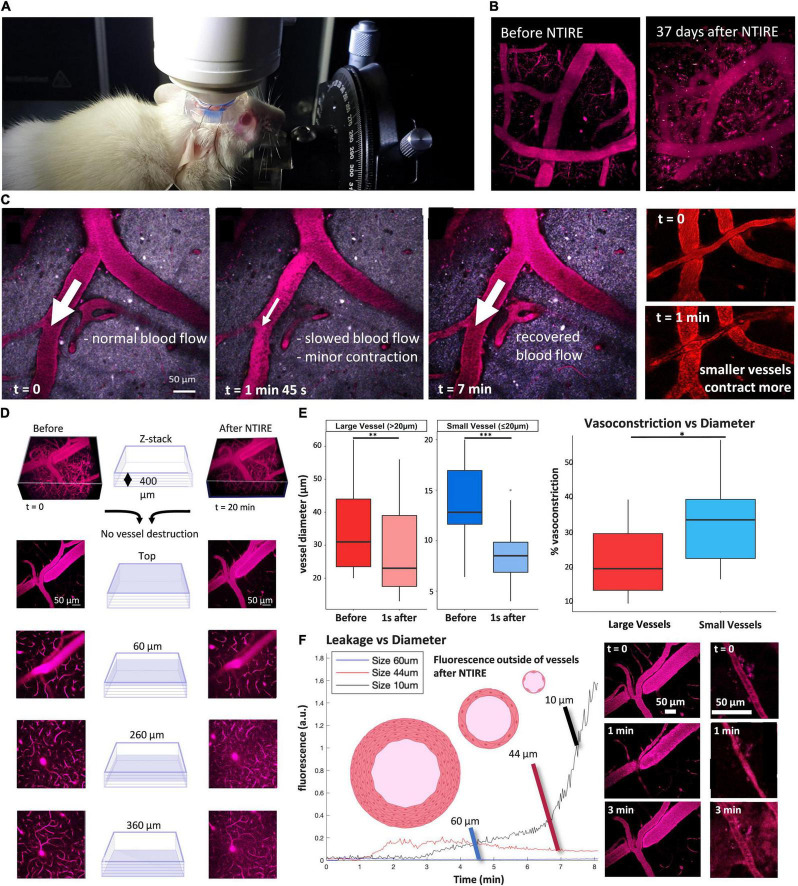
FIGURE 2.
Principal of NTIRE: Contraction, Recovery, and Leakage. (A,B) Mice and blood vessel integrity were monitored for a maximum of 37 days after the NTIRE process, with no discernable loss of vessels in the time window. (C) Blood flow (represented by the white arrows) is normal, then slowed in the minutes after the NTIRE event, and recovers for all vessels by 7 min. (D) 400 μm × 400 μm block of cortex taken between the two microelectrodes (schematically seen in Figure 1). Imaging immediately before and 7 min after NTIRE (1,750 V/cm, 10 Hz) reveals no obvious destruction of vessels, independent of vessel size. (E) Contraction: The average contraction of vessels due to NTIRE is measured, for vessels above vs. bellow 20 μm diameter, before and 1 s after NTIRE [Large vessels: p value (Shapiro test) >0.05, p-value (paired t-test) = 0.0003741. Small vessels: p-value (Shapiro test) <0.05, p-value (paired Wilcoxon test) = 0.001953]. Recovery takes approximately 1 min. The percentage of vasoconstriction for smaller vessels (diameter less than 20 μm) approaches 50% [p value (Shapiro test) >0.05, p-value (paired t-test) = 0.02622]. (F) Leakage: Leakage from vessels is estimated by considering the increase in fluorescence at a distance of 10 μm from an individual vessel. In the example here, the leakage from smaller vessels (diameter less than 20 μm – seen in the example panels, bottom right) continues for many minutes and is greater than from larger vessels, where the largest vessels (+60 μm) simply show no leak.

