
FIGURE 12.
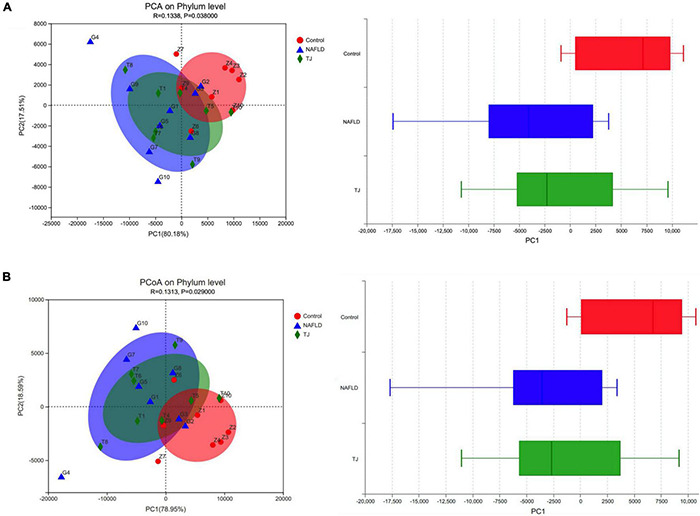
PCA and PCOA analyses of intestinal microbiota. The X and Y axes represent two selected principal component axes. Percentage represents the degree of explanation of the principal component to the difference in sample composition. The scales on the X and Y axes are relative distances. The closer the two sample points, the more similar the species composition of the two samples. The boxplot represents the distribution dispersion of the three groups of samples on the PC1 axis. (A) PCA. (B) PCOA. Z, control group. G, NAFLD group. T, 919TJ group.