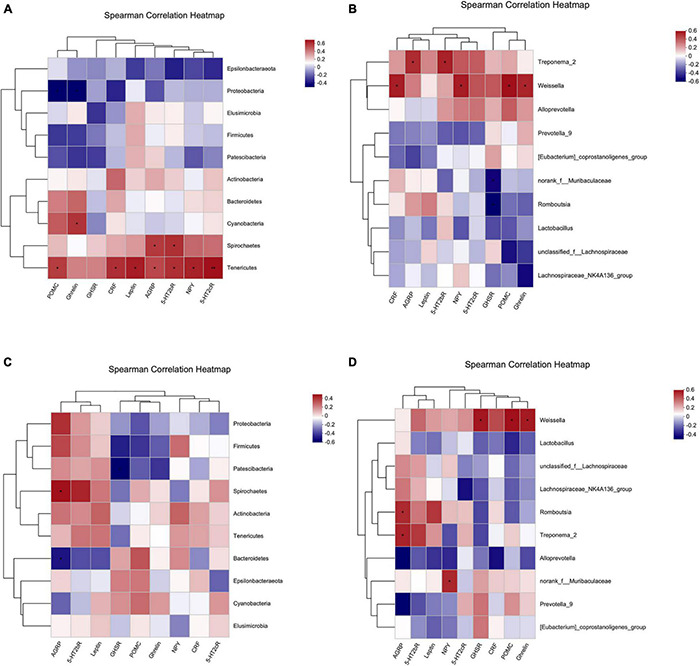
FIGURE 13.

Spearman correlation heatmap. (A,B) Correlation heatmap of hypothalamic Ghrelin pathway-related molecules and intestinal dominant microbiota. (C,D) Correlation heatmap of gastric Ghrelin pathway-related molecules and intestinal dominant microbiota. (A,C) Phylum level. (B,D) Genus level. The X and Y-axes are Ghrelin pathway-related molecules and intestinal dominant microbiota, respectively, and the correlation R-value and P-value are obtained through calculation. The R-value is shown using different colors in the figure. If the P-value is less than 0.05, it is marked with *. The legend on the right is the color interval of different R values. The species and environmental factor cluster trees are presented on the left and upper side, respectively. *: 0.01 < P ≤ 0.05, **: 0.001 < P ≤ 0.01.
