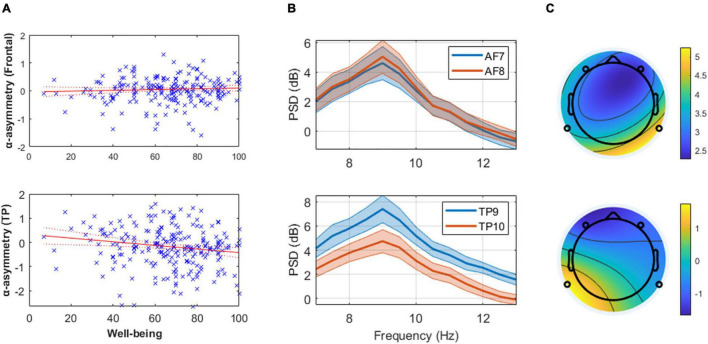
FIGURE 1.
(Panel A) These linear regression models of well-being and mean alpha asymmetry (predefined 8–13 Hz band) show the absence of relationship at frontal channels (top) and the presence of one at temporoparietal (TP, bottom) channels. Higher well-being levels are associated with greater cortical activity in the right TP area relative to the left (assuming alpha inhibits regional cortical activity). (Panel B) Mean and standard error of the alpha power spectral density (PSD) from the 20 participants with highest reported well-being level at frontal (top) and TP (bottom) channels, illustrating the results reported in (Panel A). (Panel C) Scalp topography of mean alpha PSD on a typical subject with low self-reported well-being (AIOS = 17; top) and high self-reported well-being (AIOS = 100; bottom), as an illustration of the effect reported in (Panel A).

