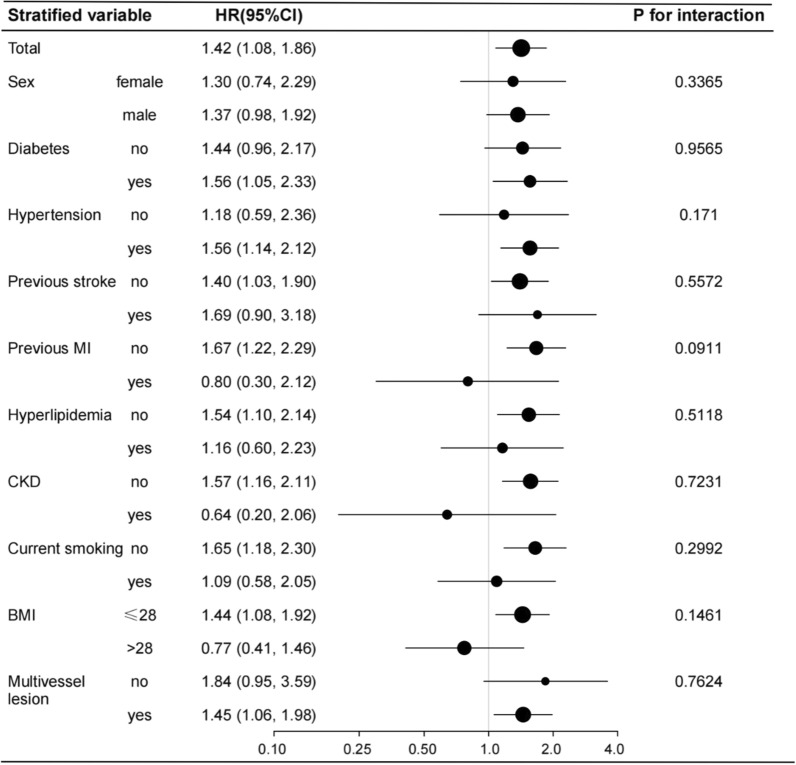
Fig. 2.
Forest plot investigating the association between the TyG index and all-cause mortality in different subgroups. Adjusted for age, gender, BMI, SBP, DBP, LVEF, Gensini score, hypertension, diabetes, hyperlipidemia, previous MI, previous stroke, CKD, current smoking, TC, LDL-C, HDL-C, eGFR, UA, aspirin, clopidogrel, statin, β-blocker, ACEI/ARB, LM lesion, multivessel lesion except for the stratified variable

