Fig. 2.
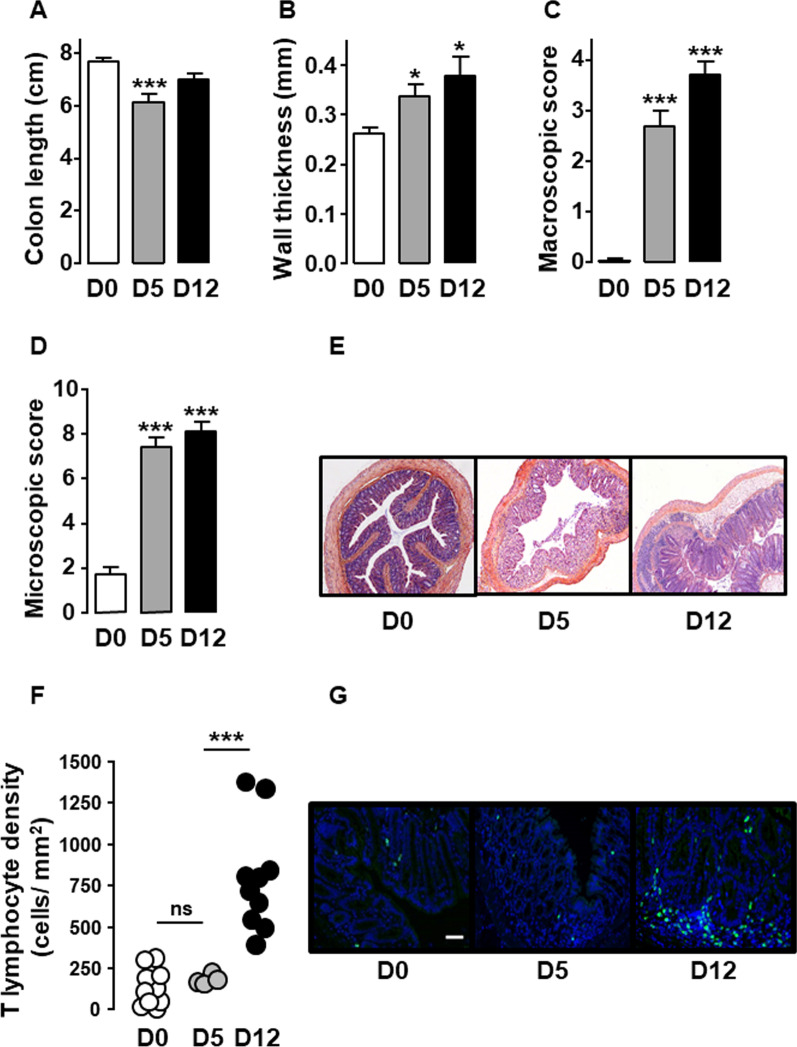
T lymphocytes accumulate within inflamed colonic mucosa upon DSS-induced colitis. Littermate wild-type mice untreated (D0, white), treated 5 days with 3% DSS (D5, grey) or treated with 3% DSS for 5 days and then with water until day 12 (D12, black) were examined for colitis severity including colonic length (A), wall thickness (B), macroscopic (C) and histological (D) colonic tissue damage (n = 10–20 mice/group). A representative histopathological analysis performed on H&E-stained colon sections in depicted in E. Untreated mice (D0) show normal epithelial architecture with neither cellular infiltration nor edema (E, left panel). Mice treated 5 days with 3% DSS (D5) show massive cellular infiltration, submucosal edema and epithelial architecture disruption (E, middle panel). Mice treated with 3% DSS for 5 days and then with water until day 12 (D12) show massive cellular infiltration, severe edemas (submucosal and subepithelial) and epithelial disruption (E, right panel). F Density of CD3+ T lymphocytes within lamina propria (each point, corresponding to one animal, represents the mean of four different histological examinations per slice) quantified per mm2 of tissue (n = 4 (D5) or 10 (D0 and D12) mice/group). A representative anti-CD3 immunostaining at day 0 (left panel), day 5 (middle panel) and day 12 (right panel) of the treatment is depicted in G (scale 50 µm). Data are expressed as mean ± SEM. Statistical analysis was performed using Kruskal–Wallis and subsequent Dunn’s multiple comparison tests. *p < 0.05, ***p < 0.001 compared to normal control mice (D0)

