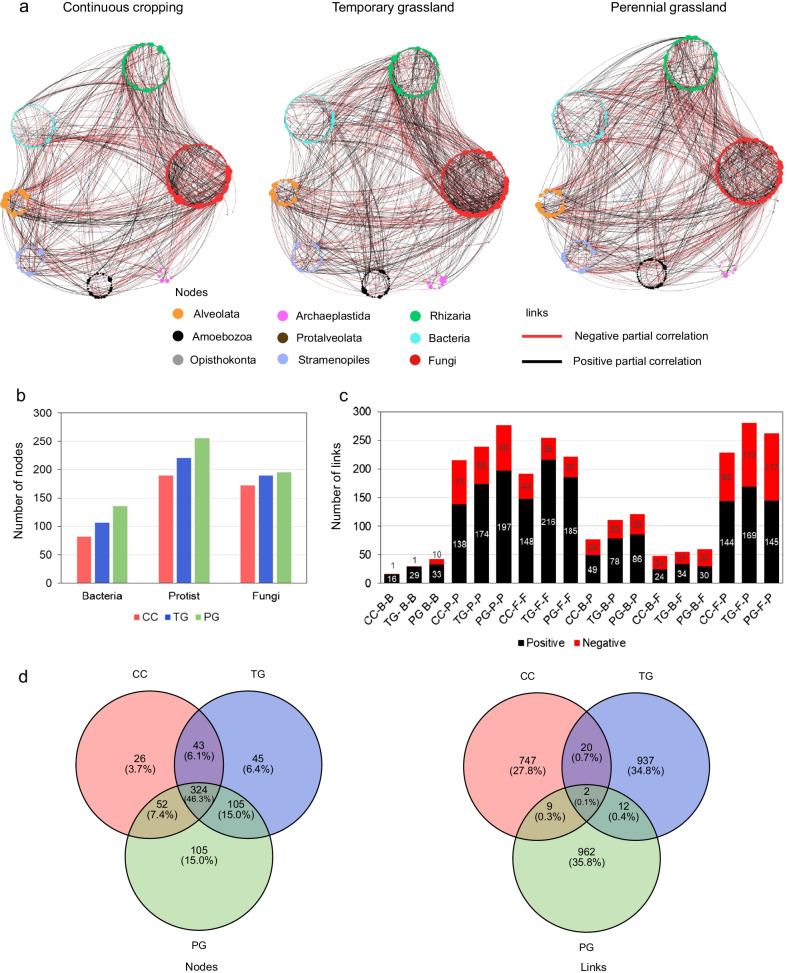
Fig. 5.
a Co-occurrence networks across three groups in continuous cropping (CC), temporary grassland (TG) and perennial grassland (PG). Nodes are colored according to their taxonomic affiliation at phylum levels. The size of the nodes is proportional to the number of links per node (i.e. degree). Link thickness is proportional to partial correlations between nodes and represents associative (black, ρ > 0.08) or exclusionary relationships (red, ρ < -0.08). b Number of nodes per land-use for each microbial group. c Number of positive (black) and negative (red) links in inter-domain networks for each land-use type and within microbial domains. d The Venn Diagrams show the number of shared/unique nodes and links across inter-domains networks

