
Fig. 1.
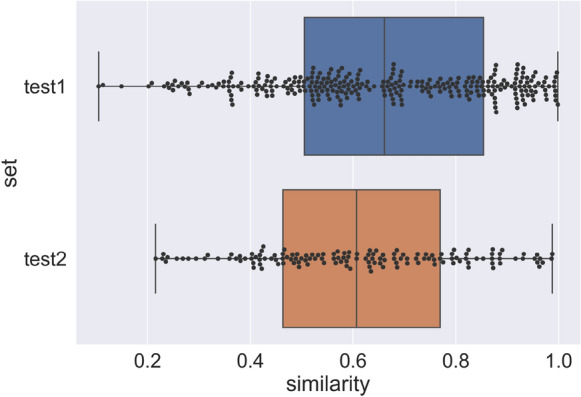
Maximum similarity of each molecule in the test sets to the molecules in the training set. The similarity was calculated using the Tanimoto coefficient similarity on the topological fingerprints of the molecules
Official websites use .gov
A
.gov website belongs to an official
government organization in the United States.
Secure .gov websites use HTTPS
A lock (
) or https:// means you've safely
connected to the .gov website. Share sensitive
information only on official, secure websites.
Maximum similarity of each molecule in the test sets to the molecules in the training set. The similarity was calculated using the Tanimoto coefficient similarity on the topological fingerprints of the molecules