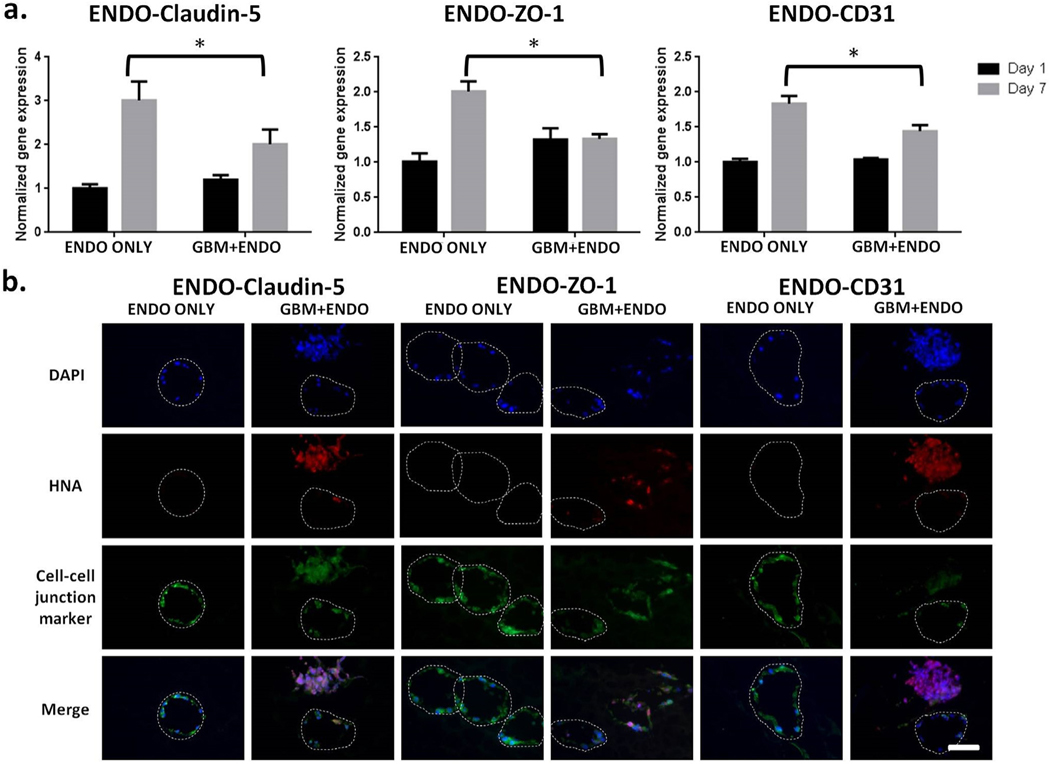
Fig. 4. Co-culture led to downregulation of endothelial cell adhesion protein expression.
(a). Expression of cell adhesion proteins in endothelial cells on day 7, normalized to day 1. Mouse specific primers were used to measure gene expression levels of claudin-5, ZO-1, and CD31 using RT-PCR. * p < 0.05. (b). Immunostaining of cell-cell junction proteins on day 14. Blue = nuclei. Red = human nuclear antigen. Green = claudin-5, ZO-1, or CD31. White dashed line = microchannel edge. Scale bar =100 μm. (For interpretation of the references to colour in this figure legend, the reader is referred to the Web version of this article.)

