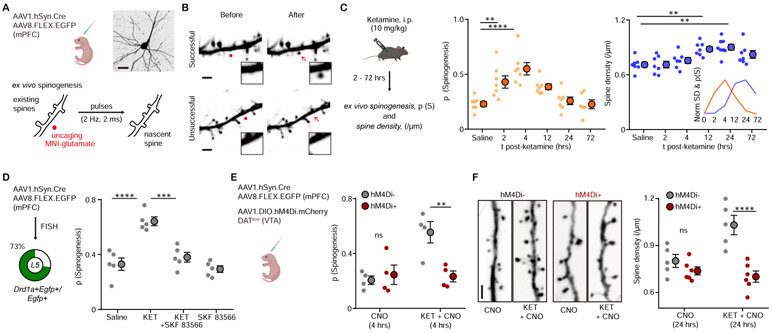
Figure 1. Ketamine regulates mPFC plasticity through a DA-dependent mechanism.
(A). Schematic illustrating glutamate-evoked de novo spinogenesis platform. Top, viral transduction and an example EGFP+ pyramidal neuron in mPFC. Bottom, MNI-glutamate uncaging parameters for the induction of new dendritic spines. Scale bar, 50 μm.
(B). Example 2PLSM images of successful and unsuccessful induction trials of de novo spinogenesis. Red circles, uncaging sites. Black rectangle, close up images of local dendritic segments before and after glutamate uncaging. Scale bar, 2 μm.
(C). Left, schematic illustrating timecourse of ketamine treatments and experiments. Middle, timecourse of evoked spinogenesis probability on deep layer mPFC neurons in mice treated with either saline or ketamine (i.p. 10 mg/kg, acute slice preparation 2-72 hrs after treatment). Each small circle, aggregate probability of evoked spinogenesis from a single animal. Large circle, group data. n = 6 - 7 animals/time point, 15 - 25 trials/animal, one-way ANOVA, F (5, 35) = 9.895, p < 0.0001, Sidak’s multiple comparison test vs Saline, 2 hrs p = 0.076, 4 hrs, p < 0.0001, 12 hrs, p = 0.0532, 24/72 hrs, p > 0.9. Right, same as left but for dendritic spine density. n = 7 - 8 animals/time point, one-way ANOVA, F (5, 37) = 6.319, p = 0.0002, Sidak’s multiple comparison test vs Saline, 2/4 hrs p > 0.8, 12 hrs, p = 0.0056, 24 hrs, p = 0.0011, 72 hrs, p = 0.1271. Inset, normalized time course of changes in evoked spinogenesis (orange) and dendritic spine density (blue).
(D). Left, viral transduction and percentage of Drd1a+Egfp+/Egfp+ cells in layer 5 mPFC. Right, probability of glutamate-evoked spinogenesis on deep layer mPFC neurons in mice treated with Saline, KET (10 mg/kg), KET + SKF 83566 (10 mg/kg), or SKF 83566 alone. Each small circle, aggregate probability of evoked spinogenesis from a single animal. Large circle, group data. One-way ANOVA, p < 0.0001, F (3, 16) = 20.29, Sidak’s multiple comparison test, Saline vs KET, p < 0.0001, KET vs KET + SKF83566, p = 0.0002, Saline vs SKF83566, p = 0.8574.
(E). Left, schematic illustrating triple viral transduction strategy for evoked spinogenesis with DA neuron inhibition. Right, probability of spinogenesis on deep layer mPFC neurons in DATiCre+ and DATiCreG− animals treated with CNO (3 mg/kg) across conditions (baseline, KET). n = 4 animals/condition as shown in plots, two-way ANOVA, Sidak’s multiple comparison test, Cre− vs Cre+, CNO, p = 0.8686, CNO + KET, p = 0.0042.
(F). Left, example confocal images of EGFP expression in dendrites of deep layer mPFC pyramidal neurons, in response to CNO and ketamine treatment, as noted. Scale, 2 μm. Right, same as (E) but for dendritic spine density. n = 5 - 6 animals/condition as shown in plots, two-way ANOVA, Sidak’s multiple comparison test, Cre− vs Cre+, CNO, p = 0.5005, CNO + KET, p < 0.0001. Scale bar, 2 μm.
** p < 0.01, *** p < 0.001 **** p < 0.0001. Error bars reflect SEM.

