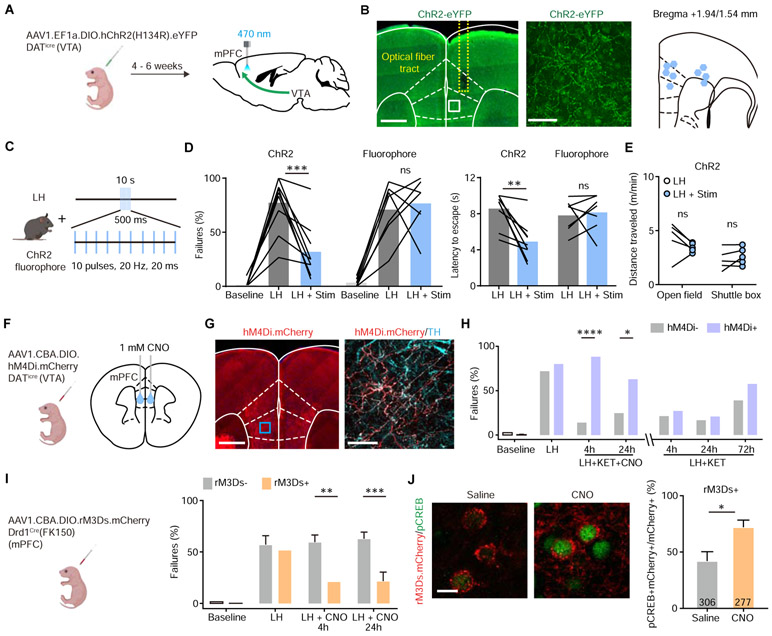
Figure 4. Activity of local DA terminals and Drd1+ neurons in mPFC mediates ketamine effects on behavior after stress.
(A). Schematic for viral transduction with Cre-dependent ChR2 AAV in the VTA and subsequent optogenetic fiber implant in mPFC.
(B). Left, fiber placement illustration on a coronal section through mPFC, with a close up image of ChR2.eYFP terminals (white dashed lines, Paxinos atlas overlay; yellow dashed lines, fiber track). Green, immunoenhanced ChR2.eYFP; blue, Hoechst nucleic stain. Scale bars: 500 μm and 50 μm. Right, atlas location of fiber placement for each subject.
(C). Schematic illustrating open loop optogenetic stimulation parameters (Stim, optogenetic stimulation).
(D). Left, summary data showing the percentage of failures to escape an escapable aversive shock in ChR2-expressing mice (n = 9) and fluorophore-expressing controls (n = 7) across phases of learning, Baseline, LH, and LH + Stim. Right, summary data for latency to escape in LH compared with LH + Stim conditions. Repeated measures two-way ANOVA, Sidak’s multiple comparison test, LH vs LH + Stim, ChR2, p = 0.0002, Fluorophore, p = 0.9358. Latency to escape, LH vs LH + Stim, ChR2, p = 0.0014, Fluorophore, p = 0.9248.
(E). Left, locomotion in the open field and shuttle box (m/min) after learning with and without optogenetic stimulation. Repeated measures two-way ANOVA, Sidak’s multiple comparison test, open field, p = 0.1742, shuttle box, p = 0.7503, n = 5 mice.
(F). Left, schematic illustrating viral transduction strategy. Right, local CNO infusion in mPFC (1 mM, 1 μl).
(G). Left, immunoenhanced image of hM4Di.mCherry+ DAT+ terminals in mPFC. Right, mCherry+ terminals colocalize with a subset of tyrosine hydroxylase (TH) expressing axons. Scale bars, 500 μm and 50 μm.
(H). Summary data showing the percentage of failures to escape an escapable aversive shock across learning and treatment conditions for hM4Di-expressing DATiCre positive and negative littermates. n = 5 animals for Cre−, 8 animals for Cre+, two-way ANOVA, Sidak’s multiple comparison test. KET + CNO 4 hrs, p < 0.0001, KET + CNO 24 hrs, p = 0.0476, KET + only 4, 24, and 72 hrs, p > 0.7.
(I). Left, schematic illustrating viral transduction strategy. Right, Summary data showing the percentage of failures to escape an escapable aversive shock in Drd1-Cre+ and Drd1-Cre− mice expressing rM3Ds across phases of learning and after CNO treatment (Baseline, LH, LH + CNO 4 hrs, and LH + CNO 24 hrs). n = 8 - 10 animals/condition, two-way ANOVA, Sidak’s multiple comparison test, Cre+ vs Cre−, LH + CNO 4 hrs, p = 0.0018, LH + CNO 24 hrs, p = 0.0007, Baseline/LH, p > 0.9.
(J). Left, colocalization of pCREB immunolabeling and rM3Ds.mCherry expression in mPFC after Saline/CNO treatment in Drd1 Cre+ mice. Right, the quantification of percentage of pCREB+ cells among mCherry+ cells. Scale bar, 20 μm. n = 3 animals/condition cell number as noted in each bar, two-tailed unpaired t-test, p = 0.0455.
*p < 0.05, ** p < 0.01, *** p < 0.001, **** p < 0.0001. Error bars reflect SEM.

