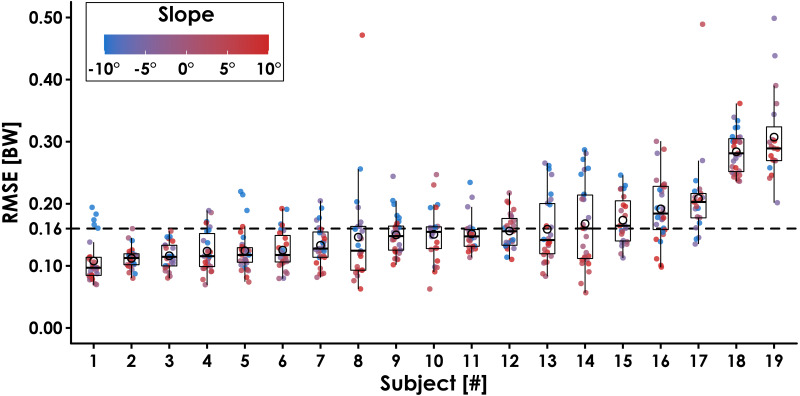
Figure 3. Ground reaction force waveform prediction error for each subject across all conditions.
The average root mean square error (RMSE) across subjects was 0.16 BW (dotted line). Filled circles represent each trial, and the color indicates slope (0°, ±5°, ±10°) at three speeds (2.5, 3.33, 4.17 m/s). Open circles represent each subject’s average RMSE, horizontal bars are the median RMSE, box plot edges indicate the interquartile range (IQR; 25th and 75th percentile), and the whiskers encompass values that fall within 1.5*IQR. Subjects are sorted from lowest to highest RMSE.

