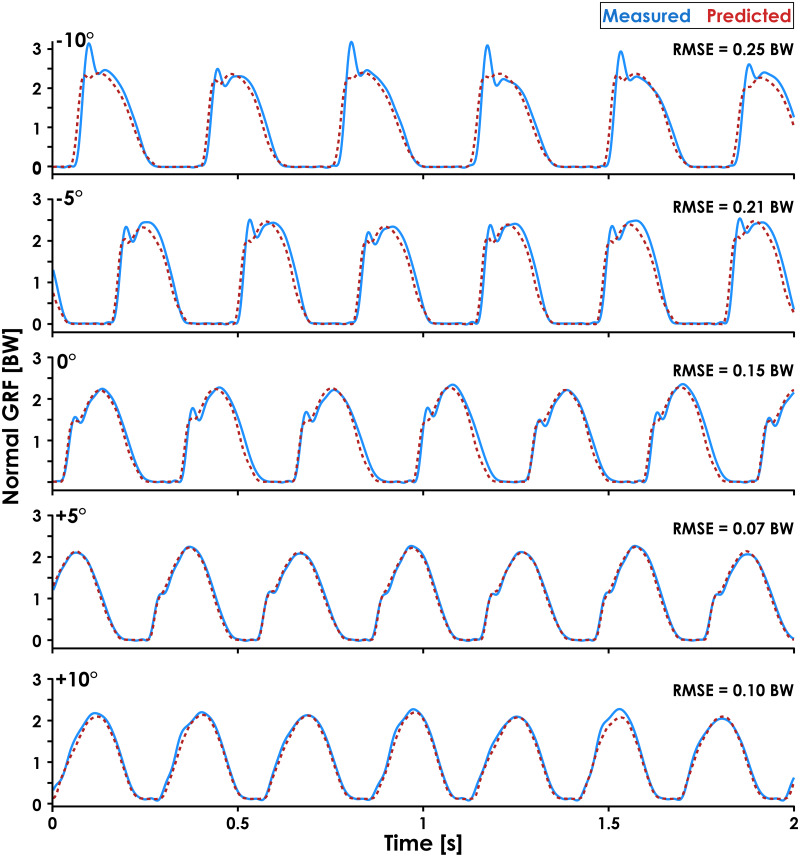
Figure 5. Predicted and measured normal GRF waveforms across slopes for a representative subject.
Normal ground reaction force (GRF) waveforms predicted by the recurrent neural network (dashed red lines) and measured by the force-measuring treadmill (solid blue lines) at 3.33 m/s and all slopes (0°, ±5°, ±10°) are presented for Subject 14. Subject 14 was selected because they had similar RMSE values (0.17 ± 0.07 BW) as the average across all subjects (0.16 ± 0.04 BW) and their GRF waveforms illustrate an interaction between running slope and normal GRF impact peak magnitude.

