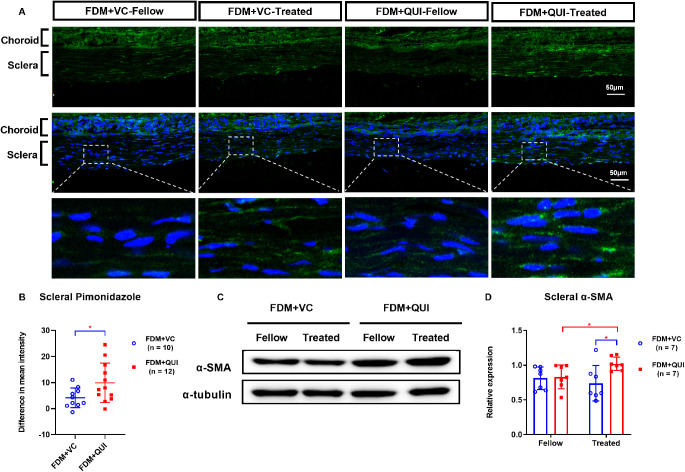
Figure 6.
Comparisons of labeling with pimonidazole in scleras (A–B) and Western blot analysis of scleral α-SMA expression (C–D) in FDM+VC and FDM+QUI groups, at the end of two weeks’ treatment. First row, hypoxia signals (green). Second row, hypoxia signals (green) plus DAPI nuclear staining (blue). Third row, higher magnification of the boxed scleral areas in the second row. Fellow, eyes contralateral to the FDM eyes and not subjected to either vitamin C or quinpirole; Treated, FDM-eyes subjected to either vitamin C or quinpirole; VC, vitamin C; QUI, quinpirole. *P < 0.05, **P < 0.01, and ***P < 0.001, independent t-test, Mann-Whitney U test, or Wilcoxon signed rank test, as appropriate.

