Figure 9.

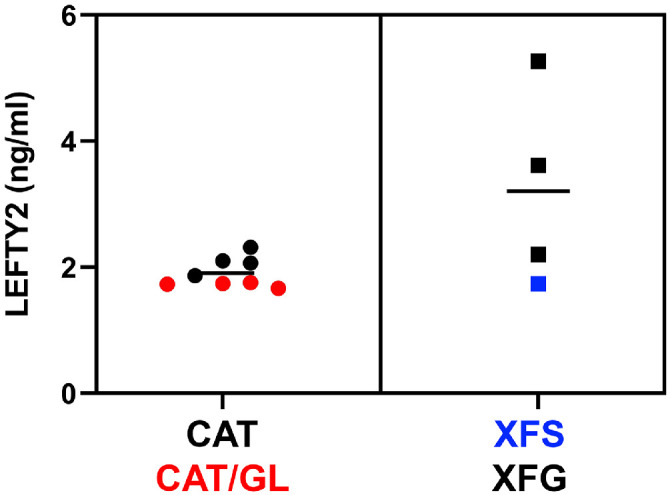
Concentration of LEFTY2 in AH samples from control (CAT, CAT/GL) or affected patients (XFS, XFG), as determined by ELISA. Horizontal line indicates the mean value in each case.

Concentration of LEFTY2 in AH samples from control (CAT, CAT/GL) or affected patients (XFS, XFG), as determined by ELISA. Horizontal line indicates the mean value in each case.