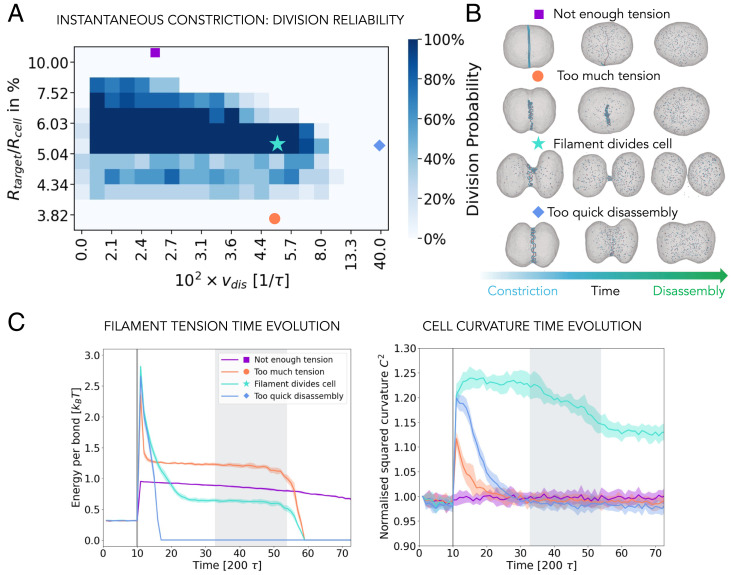
Fig. 2.
Reliability of division. (A) The influence of the filament radius reduction, , and the rate of the filament disassembly, , on the probability of cell division. The color of each square represents the percentage of successful divisions out of 10 simulations performed with different random seeds. (B) Snapshots of the representative simulations from A, as indicated by the respective symbols. (C) Time evolution of the average filament tension (Left) and average membrane curvature (Right) for the four representative points from A, as indicated by the respective labels. The filament disassembly starts at the vertical gray line in all the cases, and the shaded gray region marks the time range during which successful divisions occur (turquoise curve and star symbol). All the curves show an average over 10 simulations.

