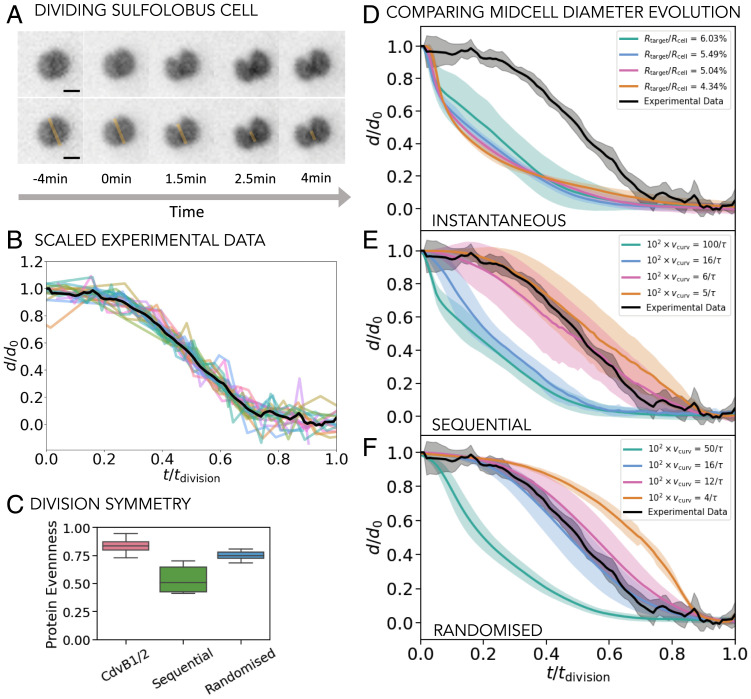
Fig. 6.
Comparison with live cell experiment. (A) Time sequence of a dividing S. acidocaldarius cell. Bottom row shows the division axis along which we measure the membrane intensity profile to determine the time evolution of the midcell (furrow) diameter. (Scale bar, 1 µm.) (B) The evolution of the midcell diameter in time. The midcell diameter d is normalized by the initial cell diameter d0, while the time is normalized by the total division time tdivision. Colored curves show the normalized measurements for individual cells (N = 23), and the black line shows the mean of all the experimentally measured curves. (C) The average of the partitioning of the constricting filament proteins in the daughter cells in experiments (CdvB1/2) and in simulations for noninstantaneous curvature change protocols that match the experimental curves for midcell evolution in time ( for the sequential and for the randomized protocol). (D–F) The normalized cell diameter evolution curves collected in simulations for different protocols (D, instantaneous; E, sequential; F, randomized) and compared to the averaged experimental data (black curve). For the instantaneous protocol different amounts of filament constriction are investigated. For the sequential and randomized protocols % and the constriction rate is varied, as shown. The disassembly rate does not influence the curves. All the simulation curves are averaged over at least 10 repetitions and the shading shows 1 SD.

