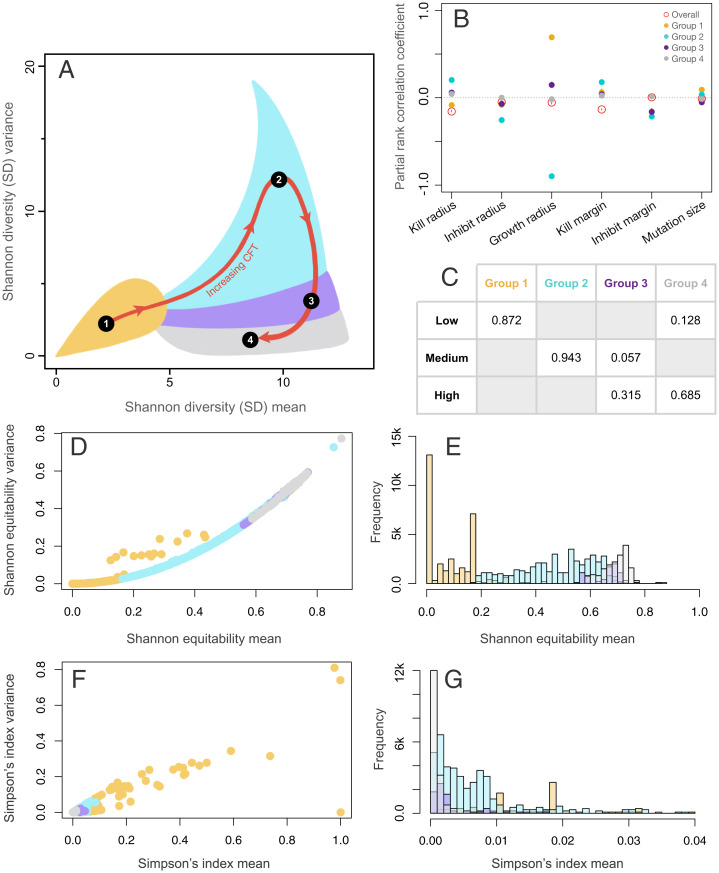
Fig. 4.
Effects of CFT on the spatial diversity dynamics. A depicts the four optimal clusters (groups) of SD mean–variance space found using k-means clustering (SI Appendix, Fig. S3). B shows the results from the PRCC analyses of the four groups and the overall data. C shows the proportion of spatial disturbance regimes present in different groups. D and F show the distribution of the values of mean and variance of Shannon equitability and Simpson’s index, respectively, for a smaller subsample of the runs with points colored by groups from A. E depicts the group-wise histogram of Shannon equitability, and G depicts the histogram of Simpson’s index (for clarity, only the range between 0 and 0.04 is shown).

