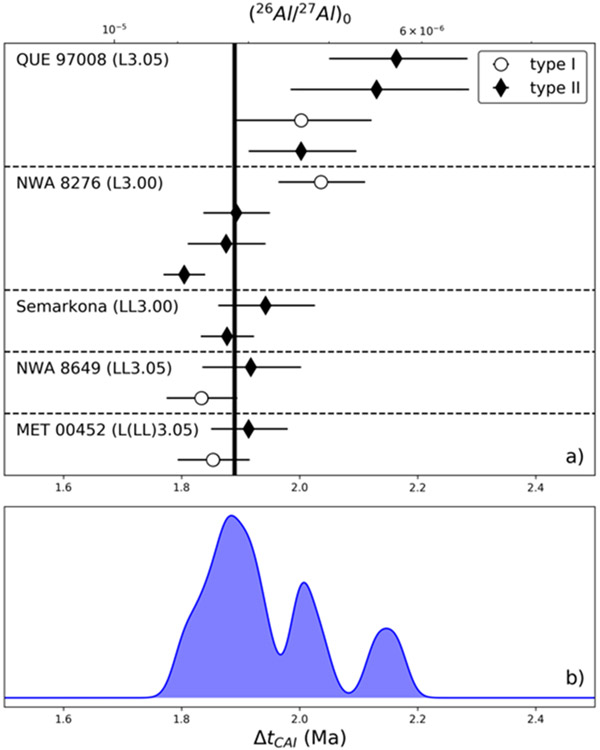
Fig. 11:
a) Compilation of initial 26Al/27Al ratios (upper axis) and corresponding age after CAI (lower axis) computed from internal isochron for each chondrule from this study. Error bars shown are uncertainties from isochron regression in Figs. 10-11. Chondrule type are as follows: type-I (open dots) and type-II (filled diamonds). The thick black line represents the weighted mean age for all chondrules. b) Kernel density function for the distribution of all ages from this study.

