
Fig. 4:
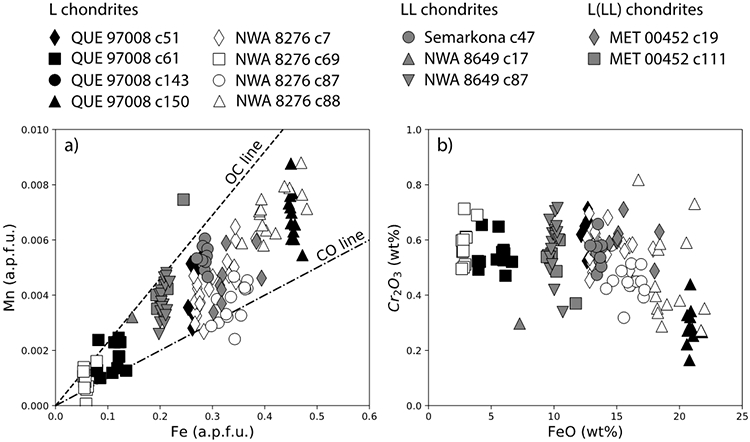
Composition of olivine analyses from the studied chondrules. a) Fe (a.p.f.u.) vs Mn (a.p.f.u.) diagram with OC (chondrule olivines from ordinary chondrites) and CO (chondrule olivines from CO chondrites) lines from Berlin et al. (2011). b) FeO (wt%) vs Cr2O3 (wt%) diagram. a.p.f.u = atoms per formula unit.