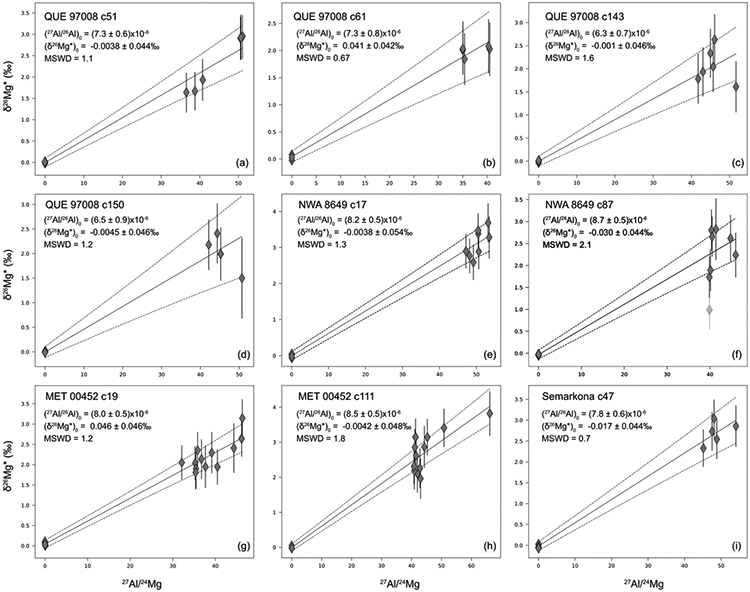
Fig. 9:

Internal isochron regression for 9 studied chondrules in this study. Error bars represent 2SE. The solid lines represent the regressions and dash lines are 95% confidence interval on the fit. Uncertainties for (26Al/27Al)0 and (δ26Mg*)0 are 95% confidence level.
