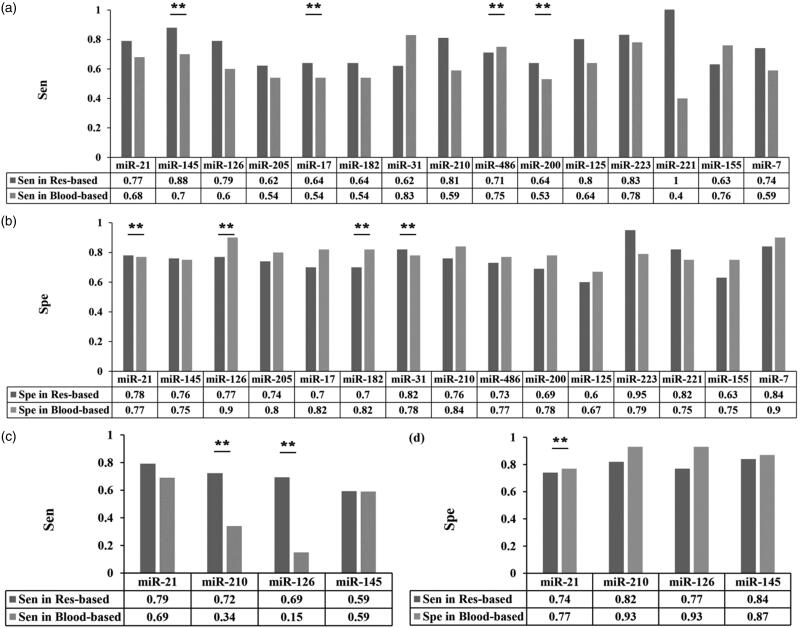
Figure 3.
The diagnostic value of several single-miRNAs in NSCLC between different sample sources. (a–d) The difference in diagnostic power of a certain miRNA between respiratory-based and blood-based samples for NSCLC (a–b) and early NSCLC (c–d) through comparison of sensitivity (a, c) and specificity (b, d). Colour in dark gray refers to respiratory-based samples while colour in light gray refers to blood-based samples.

