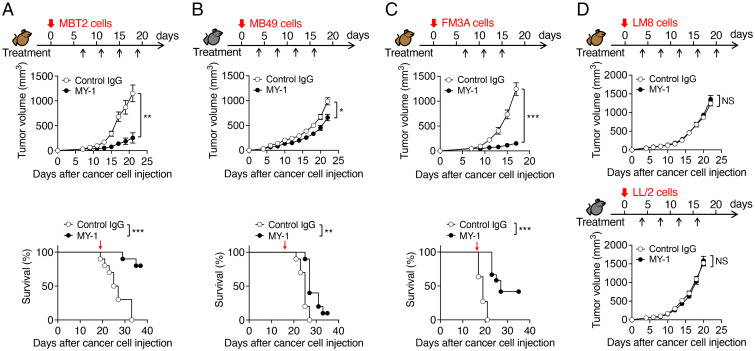
Fig. 1.
MY-1 attenuates the growth of tumors formed by murine bladder or mammary cancer cells in mice. (A–C) Tumor volume (Upper) and Kaplan–Meier survival curves (Lower) for immunocompetent mice injected subcutaneously with MBT2 (A), MB49 (B), or FM3A (C) cells and treated intraperitoneally with MY-1 or control IgG (each at a dose of 200 μg) according to the indicated schedule. Data for tumor volume are means ± SEM [n = 10 (A), 18 (B), or 11 or 12 (control IgG or MY-1, respectively) (C) mice per group examined in two (A and C) or three (B) separate experiments]. Survival data are for 10 (A and B) or 11 or 12 (control IgG or MY-1, respectively) (C) mice per group examined in two separate experiments. Red arrows (Lower) indicate the last dose of treatment. (D) Tumor volume for immunocompetent mice injected subcutaneously with LM8 (Upper) or LL/2 (Lower) cells and treated intraperitoneally with MY-1 or control IgG (each at 200 μg) according to the indicated schedule. Data are means ± SEM (n = 10 mice per group examined in two separate experiments). *P < 0.05, **P < 0.01, ***P < 0.001, NS by two-way repeated-measures ANOVA with the Greenhouse–Geisser correction and Šídák’s multiple-comparison test (tumor volume) or the log-rank test (survival). NS, not significant (in all figures where found).

