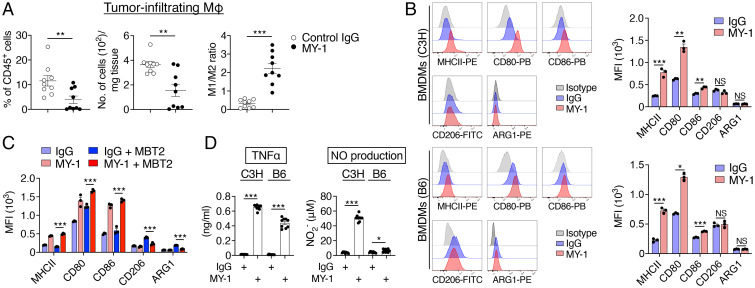
Fig. 3.
MY-1 promotes the polarization of mouse macrophages toward an M1-like phenotype. (A) C3H mice were injected subcutaneously with MBT2 cells and treated with control IgG or MY-1 (each at 200 μg) every 4 d beginning 7 d after cell injection. At 21 d after cancer cell injection, immune infiltrates of tumors were analyzed by flow cytometry for the frequency of macrophages (CD45+CD11b+Ly6ClowF4/80+ cells) among all viable CD45+ cells (Left), the absolute number of macrophages (Middle), and the ratio of M1-like macrophages (CD45+CD11b+Ly6ClowF4/80+MHCIIhigh cells) to M2-like macrophages (CD45+CD11b+Ly6ClowF4/80+CD206+ cells) (Right). MΦ, macrophages. (B) BMDMs from C3H (Upper) or B6 (Lower) mice were treated with control IgG or MY-1 (each at 10 μg/mL) for 48 h and then subjected to flow cytometric analysis of the expression of MHCII, CD80, CD86, CD206, and ARG1. Representative overlaid flow cytometry histograms (Left) and quantitative data for median fluorescence intensity (MFI) (Right) from three separate experiments are shown. (C) MFI for MHCII, CD80, CD86, CD206, and ARG1 expression in C3H BMDMs cultured with or without MBT2 cells and in the presence of control IgG or MY-1 (each at 10 μg/mL) for 24 h. (D) C3H or B6 BMDMs were treated with control IgG or MY-1 (each at 10 μg/mL) for 48 h, after which culture supernatants were collected and assayed for TNFα and NO. All quantitative data are means ± SEM for n = 9 mice per group examined in three separate experiments (A), for three separate experiments (n = 3 for each group) (B and C), or for three separate experiments, each performed in triplicate (n = 9 per group) (D). *P < 0.05, **P < 0.01, ***P < 0.001, NS (two-tailed Welch’s t test).

