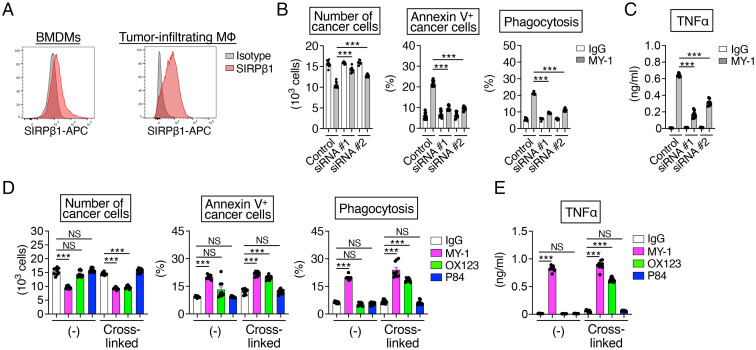
Fig. 6.
Importance of mouse SIRPβ1 for the MY-1–induced killing activity of macrophages for murine bladder cancer cells. (A) Representative flow cytometric histograms for mouse SIRPβ1 expression on BMDMs from C3H mice (Left) and on tumor-infiltrating macrophages isolated from MBT2 tumor–bearing C3H mice (Right). Data are representative of three separate experiments. (B) C3H BMDMs transfected with control or mouse SIRPβ1 (#1 or #2) siRNAs were incubated for 16 h with CFSE-labeled MBT2 cells in the presence of control IgG or MY-1 (each at 10 μg/mL). The cells were then harvested, and the number of cancer cells (Left), the percentage of annexin V+ cancer cells (Middle), and the percentage of BMDMs that had phagocytosed cancer cells (Right) were determined as in Fig. 2 A–C. (C) TNFα production by C3H BMDMs that had been transfected with the indicated siRNAs and treated with control IgG or MY-1 (each at 10 μg/mL) for 24 h. (D) CFSE-labeled MBT2 cells were cultured for 16 h with C3H BMDMs in the presence of control IgG, MY-1, OX123, or P84 (each at 10 μg/mL) or of the same agents that had been preincubated with the F(ab')2 fragment of goat pAbs to the Fc region of rat IgG so as to induce cross-linking. The number of cancer cells (Left), the percentage of annexin V+ cancer cells (Middle), and the percentage of BMDMs that had phagocytosed cancer cells (Right) were determined as in Fig. 2 A–C. (E) C3H BMDMs were treated with the indicated agents for 48 h, after which culture supernatants were harvested and assayed for TNFα. All quantitative data are means ± SEM for three separate experiments, each performed in triplicate (n = 9 for each group) (B–E). ***P < 0.001, NS (Welch and Brown–Forsythe ANOVA with Dunnett’s T3 multiple-comparison test).

