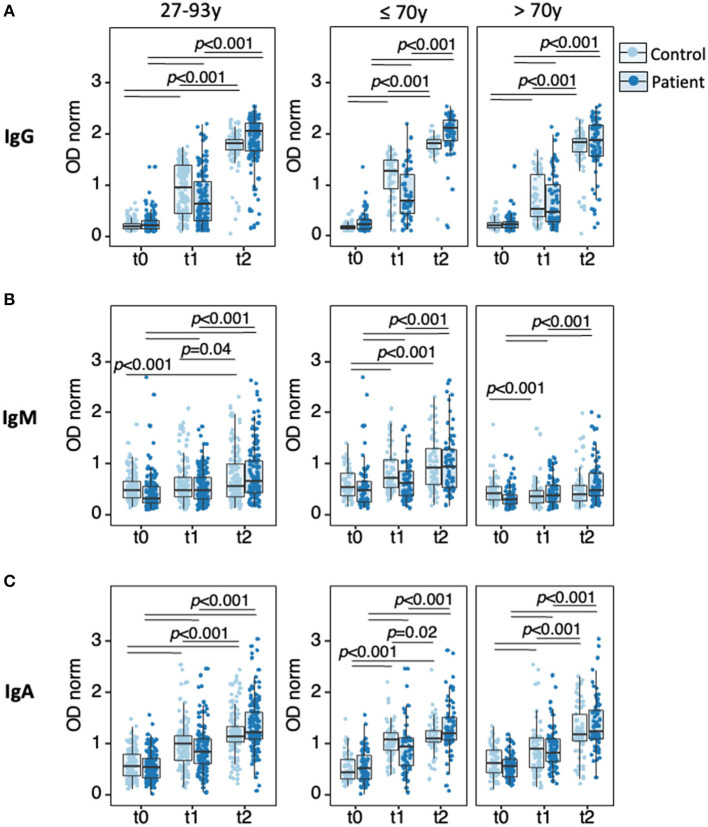
Figure 3.
Anti-SARS-CoV-2-spike IgG, IgM, and IgA responses to vaccination. Sera collected at t0, t1, and t2 were analyzed by ELISA for semi-quantitative measurement of anti-spike IgG (A), IgM (B), and IgA (C) in HD patients (dark blue, n = 143) and age-matched controls (light blue, n = 143), in the full cohort (left panels) or upon stratification by age group (≤ 70 y, middle panels; >70 y, right panels). Data points represent individual subjects and are overlaid with boxes representing interquartile range (IQR), whiskers representing 1.5 IQR tails, and a central line representing median value. Differences were determined by Quade test for antibody levels along time in the full cohort (all 9 panels), Wilcoxon signed-rank test for pairwise comparison in each panel (p-values indicated by horizontal black bars), and Wilcoxon rank-sum to compare controls with patients at t1. Detailed p-values presented in Supplementary Tables 3–7. t0, sera collected on the day of first vaccine dose; t1, sera collected 21 days post-first vaccine dose; t2, sera collected 42 days post-first vaccine dose.

