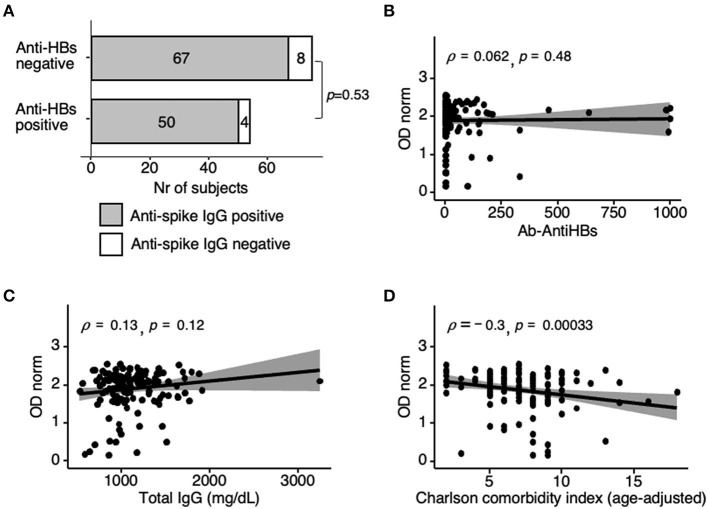
Figure 5.
Correlation analysis of anti-spike IgG responses at t2. (A) Anti-spike positivity as in Figure 2, now in n = 75 non-responders and n = 54 responders to previous hepatitis B vaccination (anti-HBs antibody cut-off >10 mIU/ml). Fischer's test p-value = 0.53; OR = 1.49, 95%CI [0.48–4.65]. Fourteen anti-HBc reactive participants (i.e., previously infected with HBV) were excluded. (B) Spearman correlation coefficients (ρ) analysis of anti-spike IgG with anti-HBs antibody levels in anti HBc non-reactive individuals (n = 129, same as in A). (C,D) Spearman correlation coefficients (ρ) analysis of anti-spike IgG levels with total serum IgG also determined at t2 (n = 142) (C), and with age-adjusted Charlson-comorbidity index (n = 142) (D). Shaded areas represent 95% confidence interval. Differences were determined by Spearman's rank-order non-parametric test; t2, sera collected 42 days post-first vaccine dose.

