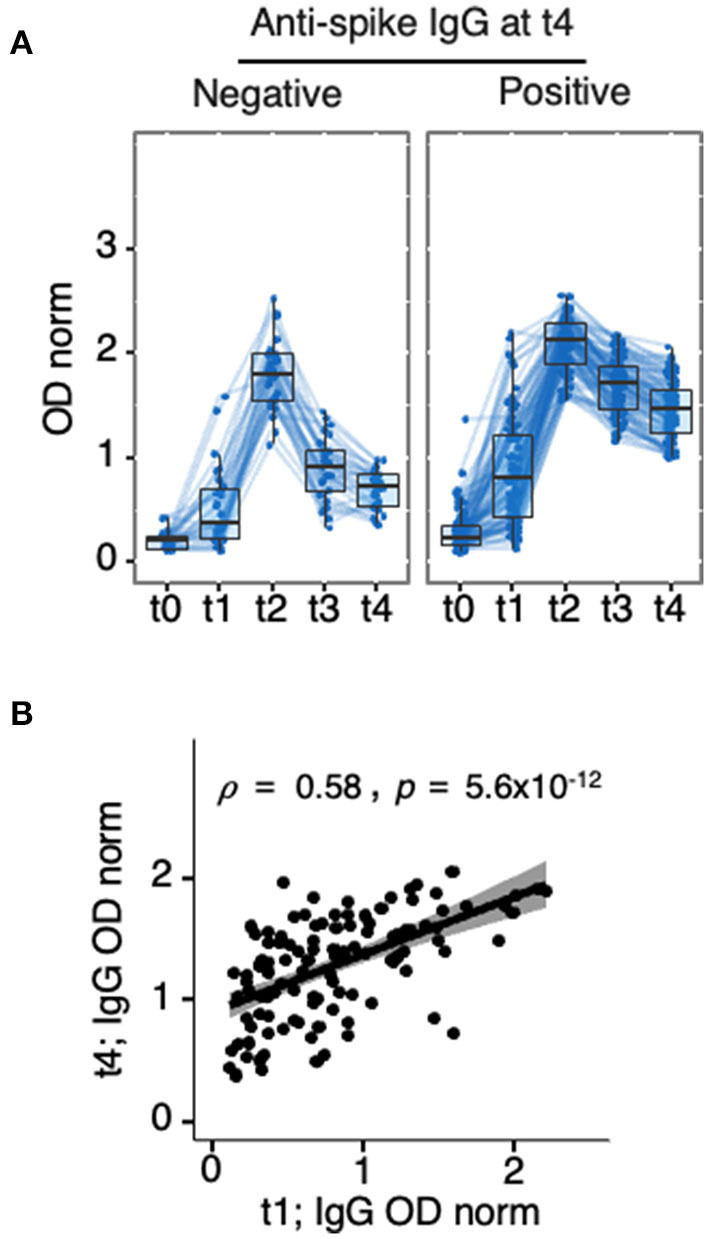
Figure 7.

Anti-spike IgG levels at t1 as a predictor of seroreversion. Longitudinal analysis of anti-spike IgG in HD patients who participated in the 5 collection time points (t0, t1, t2, t3, and t4). Ten non-responders (seronegative at t1 and t2) were excluded from the analysis, (n = 116) (A) Partitioning of data presented in Figures 3, 6, showing HD patients classified as negative (n = 39, left), or positive (n = 87, right) at t4. (B) Spearman correlation coefficients (ρ) analysis of anti-spike IgG levels at t4 vs. t1 in same (n = 126) patients, p-value inserted in the panel was obtained by Spearman's rank-order non-parametric test. Detailed p-values presented in Supplementary Tables 11–13. t0, sera collected on the day of first vaccine dose; t1, sera collected 21 days post-first vaccine dose; t2, sera collected 42 days post-first vaccine dose; t3, sera collected ~140 days post-first vaccine dose; t4, sera collected 180 days post-first vaccine dose.
