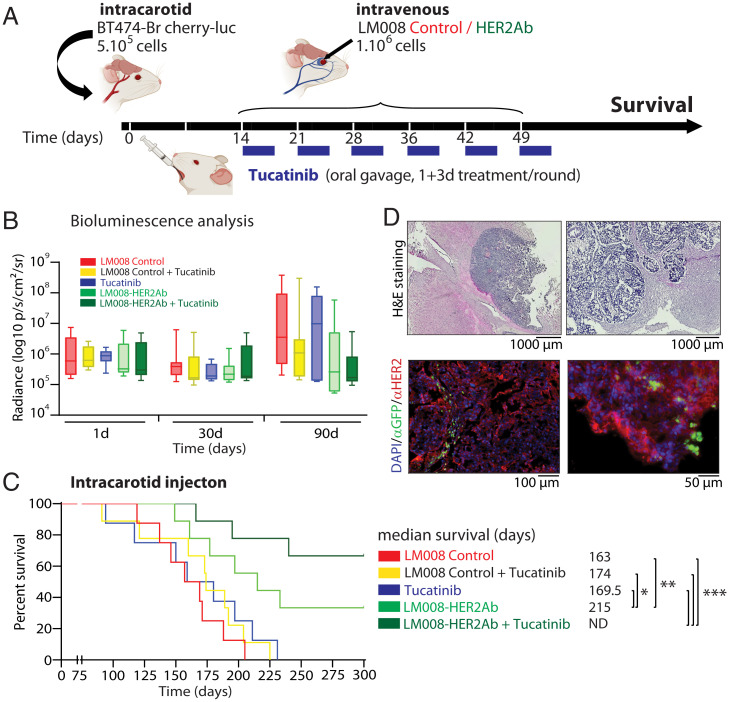
Fig. 5.
Combined LM008–HER2Ab NSCs and tucatinib result in an extended survival in a HER2+ BCBM preclinical model. (A) Schematic representation of the experimental design. Firefly luciferase–positive BT474-Br cells were injected systemically via intracarotid artery in immunodeficient (nu/nu) mice for the generation of multiple models of brain metastases. Mice were randomly divided into five groups, receiving sequential systemic intravenous injections of either LM008 vector control, LM008–HER2Ab NSCs, or PBS. A total of 106 NSCs (or 100 μL PBS) were injected in the corresponding groups once a week during 6 consecutive weeks. In addition, tucatinib (20 mg/kg) was administered by oral gavage for four consecutive days per week across the 6-wk period. Thus, two groups of mice received LM008 control cells ± tucatinib, two other groups received LM008–HER2Ab NSCs ± tucatinib, and one final group received placebo (PBS) + tucatinib as a therapeutic regimen. End-point survival was then evaluated. (B) Quantitation of firefly luciferase BLI signal intensity (log10 p/s/cm2/sr) in the brain of mice from the indicated groups and the indicated time points. (C) Kaplan–Meier graph showing percent of survival in mice injected with BT474-Br systemically and treated with LM008 vector control (median survival 163 d), LM008 vector control + tucatinib (174 d), PBS + tucatinib (169.5 d), LM008–HER2Ab cells (215 d), or LM008–HER2Ab cells + tucatinib (median survival not determined). (D) Representative histopathological and immunofluorescence pictures of brain sections harvested from mice treated with LM008 vector control or LM008–HER2Ab NSCs. Note the presence of NSCs (GFP-positive staining shown in green) embedded within the tumor mass (HER2 positive, shown in red). Nuclear staining (DAPI) is shown in blue. Bar graph represents mean ± SD. Statistical analysis was performed using one-way ANOVA with post hoc Tukey’s test (B), and log-rank test was applied to compare mice survival (C, n = 9 per group).

