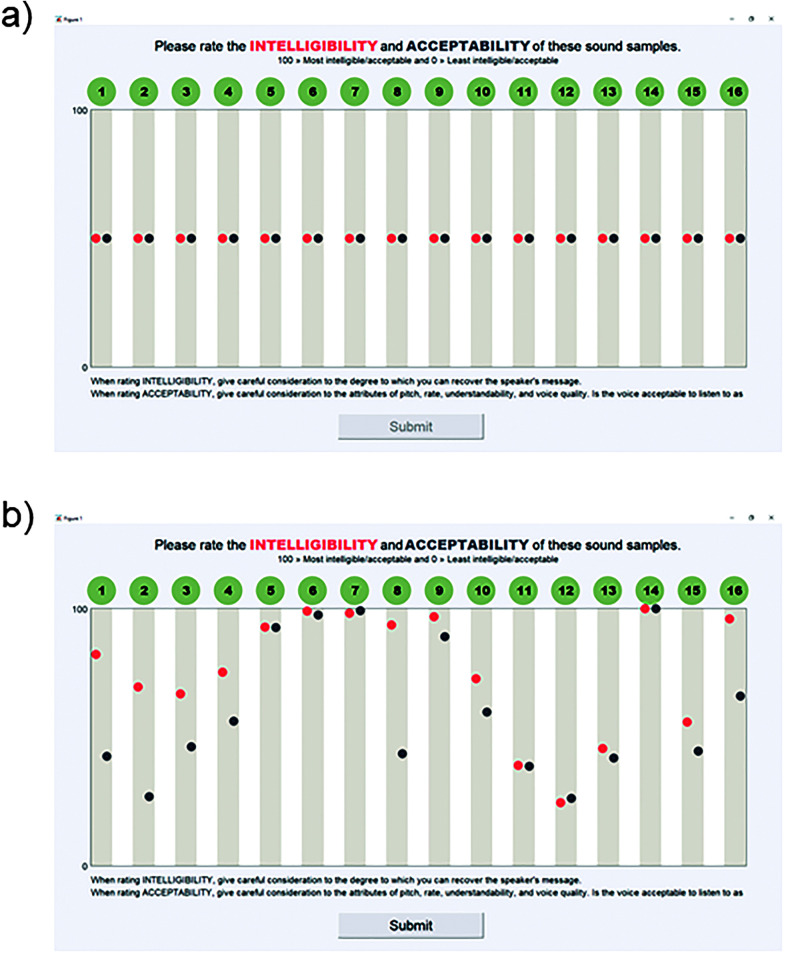
Figure 3.
An example of the visual sort-and-rate graphical user interface (a) at initialization and (b) after a listener rates the intelligibility and acceptability of each sample. Sound clips are denoted by the green circles (1 phrase × 16 voice sources). Red circles represent intelligibility ratings, and blue circles represent acceptability ratings.

