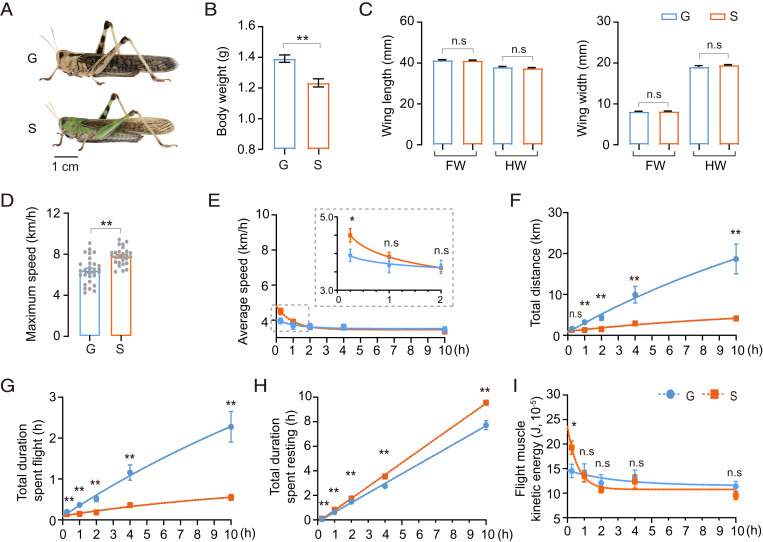
Fig. 1.
Flight trait divergence between gregarious and solitary locusts. (A) Typical gregarious and solitary adult locusts. G and S represent gregarious and solitary locusts, respectively (n = 28 individuals, Student’s t test). (B and C) Morphological comparisons between G and S. FW and HW represent forewing and hindwing, respectively (n ≥ 20 individuals, Student’s t test). (D) Comparison of maximum flight speed between G and S. Each dot represents a single individual (Mann–Whitney U test). (E–H) The measurement of flight parameters (E) average flight speed, (F) total flight distance, (G) total duration of flight, and (H) total duration of resting. (I) Comparison of flight muscle kinetic energy between G and S during flight. Flight performance for 0.25-, 1-, 2-, 4-, and 10-h tests were compared. Data for each time point was obtained independently, n ≥ 20 individuals at each time point (Mann–Whitney U test). The fitting curve was obtained by nonlinear regression. All data are presented as the mean ± SEM, *P < 0.05, **P < 0.01, and n.s, not significant.

