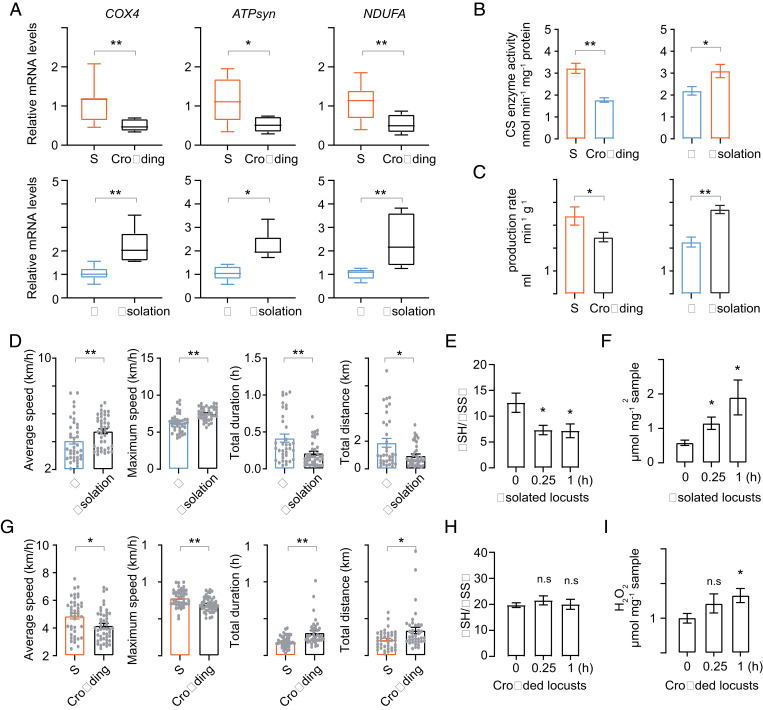
Fig. 5.
Energy metabolism and flight trait are reshaped by population density changes. G and S represent gregarious and solitary locusts, respectively. (A) Expression profiles of key genes related to aerobic energy metabolism in response to the crowding and isolation treatment, respectively (n = 8, Student’s t test). (B) Citrate synthase enzyme activity measurement (n = 8, Student’s t test). (C) CO2 production rate measurement (n = 11 individuals, Student’s t test). Isolation treatments were normalized to typical gregarious locusts, and crowding treatments were normalized to typical solitary locusts. (D) Flight performance comparison after isolation treatment (n ≥ 30 individuals, Mann–Whitney U test). Each dot represents a single individual. (E and F) GSH/GSSG and H2O2 content measurement of isolated locusts during flight (n ≥ 6, Student’s t test). (G) Flight performance comparison after crowding treatment (n ≥ 30 individuals, Mann–Whitney U test). (H and I) GSH/GSSG and H2O2 content measurement of crowded locusts during flight (n ≥ 6, Student’s t test). Time points are shown as 0.25- and 1-h flight treatment, each time point is compared to rest condition samples. The data are shown as mean ± SEM, *P < 0.05, **P < 0.01, and n.s, not significant.

