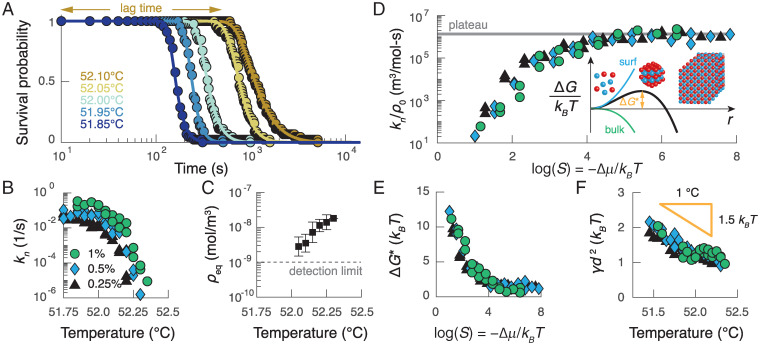
Fig. 2.
The kinetics of nucleation can be predicted by a modified version of CNT. (A) The survival probability for a colloid concentration of 0.25% (vol/vol) as a function of time for different temperatures (colors). Points show data, and curves show fits of the model described in the main text. (B) The measured nucleation rate as a function of temperature at three different particle volume fractions: 0.25% (black triangles), 0.50% (blue diamonds), and 1.00% (green circles). At the lowest temperatures, the nucleation rate plateaus; at higher temperatures, the nucleation rate decreases superexponentially with temperature. (C) Average measurements of the equilibrium gas density as a function of temperature. The error bars represent the SD of the measurements for all three colloid concentrations and two independent experimental trials. (D) The nucleation rate divided by the initial colloid concentration as a function of the supersaturation S. Inset illustrates the free-energy barrier as a function of the cluster radius that results from the classical theory of nucleation. (E) The inferred barrier height as a function of supersaturation. (F) The inferred surface tension γ as a function of temperature for the experiments in B. The surface tension decreases with increasing temperature as expected given the temperature dependence of DNA hybridization; d is the colloid diameter.

