Fig. 1.
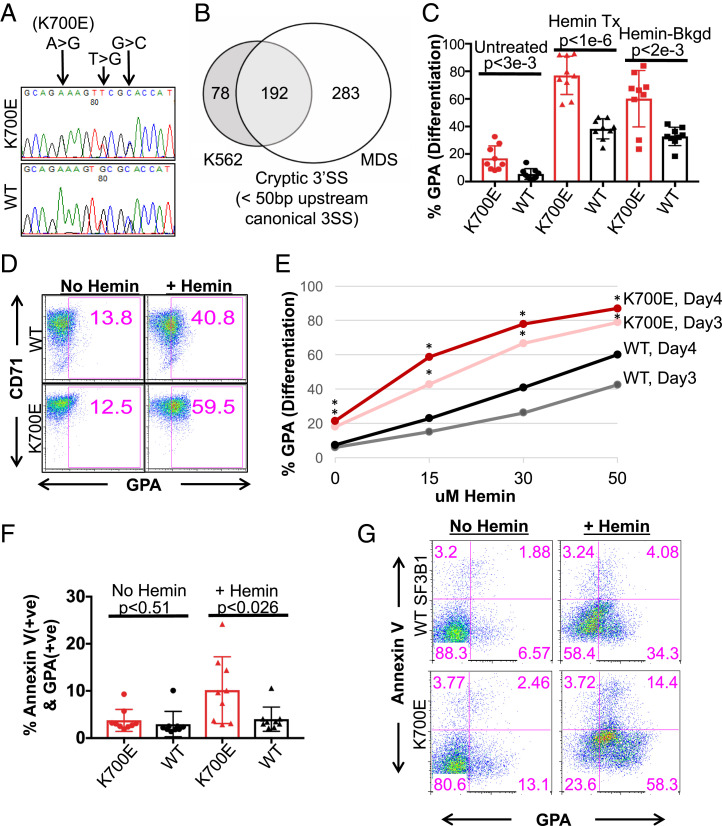
K562/SF3B1 K700E cells exhibit accelerated differentiation and increased erythroid cell death as compared to WT cells. (A) DNA chromatograms of representative K562/SF3B1 mutant and WT clones, showing K700E and two silent mutations in the SF3B1 gene. (B) Venn diagram showing the overlap of cryptic 3′ss (cutoff at q-value < 0.05, distance < 50 nt to the associated canonical 3′ss) that were utilized significantly more in SF3B1 mutants than in SF3B1 WT K562 cells and MDS patients. (C) Bar graph quantifying the percentage of surface GPA+ cells as analyzed by flow cytometry (FACS) with cells that were treated or not with the erythroid inducer hemin (50 μM) for 3 d. Data shown represent n = 6 independent experiments. Each dot represents an independently derived cell clone. P values obtained from t tests are shown. (D) FACS plots of representative mutant and WT clones from C with similar background, displaying percent CD71 (transferrin receptor) and GPA+ cells following hemin treatment, as indicated. GPA positivity was gated based on unstained WT and mutant cells. (E) Line graph displaying percent GPA positive cells vs. various concentrations (μM) of hemin for mutant and WT clones as measured by FACS after 3 and 4 d of hemin or no treatment. *P < 0.05. (F) Bar graph specifying the percentages of AnnexinV vs. GPA expressed on the surface of K700E and WT cells as measured by FACS after hemin (50 μM) or no treatment for 4 d. Representative data from n = 4 independent experiments. P values from t tests are shown. (G) FACS plots (lower left quadrants of each plot: GPA-AnnexinV− as undifferentiated cells; Lower Right quadrants: GPA+AnnexinV− as nonapoptotic erythroids; Upper Right quadrants: GPA+AnnexinV+ as apoptotic erythroids; Upper Left quadrants: GPA−AnnexinV+ as apoptotic cells) of representative mutant and WT clones from G showing the percentages of AnnexinV vs. GPA expression under 4 d of hemin or no treatment.

