Fig. 2.
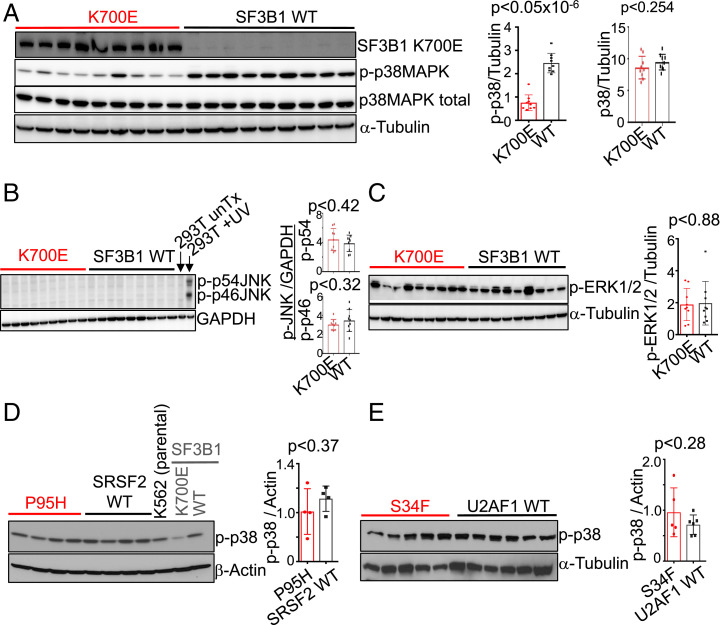
p38 MAPK is specifically deregulated and only in mutant SF3B1 cells. (A) Representative western blot images showing expression of total p38 MAPK, phospho-p38 MAPK (p-p38MAPK; p-p38), SF3B1 K700E and α-Tubulin in the independent mutant and WT K562/SF3B1 clones. n = 5 independent experiments. Representative western blot analysis of (B) phospho-JNK (p-p46 and p-p54) and GAPDH, and (C) phospho-ERK1/2 (p-ERK12) and α-Tubulin in K562/SF3B1 K700E and WT clones. Representative western blot analysis of p-p38 in (D) K562/SRSF2 mutant (P95H) and WT and in (E) K562/U2AF1 mutant (S34F) and WT independent clones. For B and C, n ≥ 3, and for D and E, n = 2 independent experiments. Bar graphs are shown next to all western blot images, displaying results of ImageJ-quantified, loading control-normalized protein band intensities and P values from t tests.

