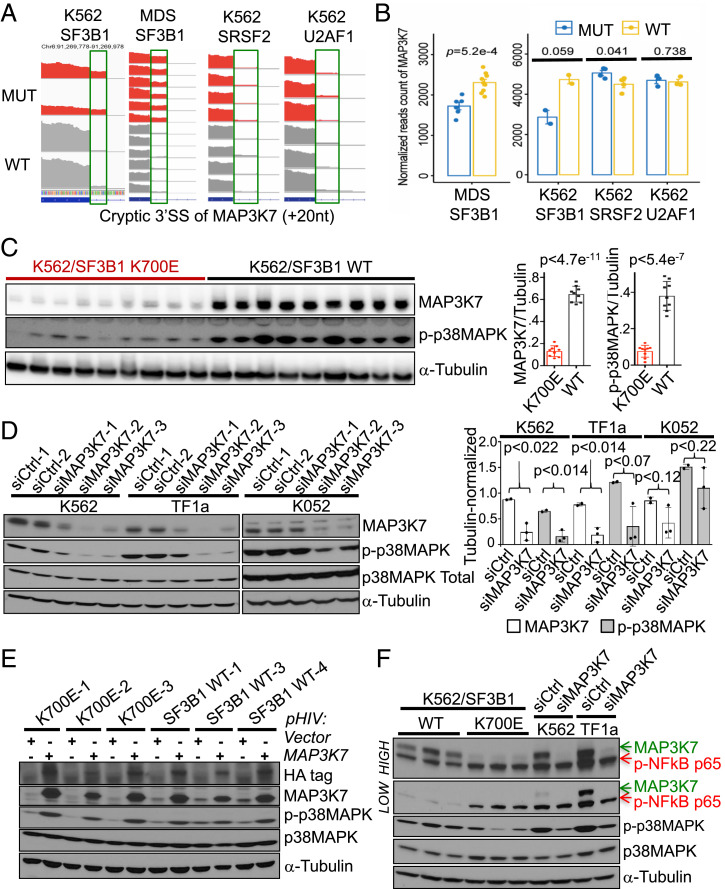
Fig. 3.
MAP3K7 transcripts are misspliced in mutant SF3B1 cells, and this is responsible for p38 deactivation. (A) RNA-seq coverage plots of MAP3K7 cryptic 3′ss transcripts in WT and mutated samples from (left to right) K562/SF3B1, MDS patients, K562/SRSF2, and K562/U2AF1 cells. (B) Comparison of total MAP3K7 mRNA levels (normalized reads counts) in WT and mutated RNA-seq samples from (left to right) MDS patients, K562/SF3B1, K562/SRSF2, and K562/U2AF1 cells. P values from t tests are shown. (C) Representative western blot images showing expression of MAP3K7, p-p38 MAPK, and α-Tubulin proteins in the independent mutant and WT K562/SF3B1 clones. n ≥ 6 independent experiments. (Right) Bar graphs displaying the results of ImageJ-quantified, α-Tubulin-normalized band intensities and P values from t tests. (D) Representative western blot analysis of the effects on p-p38 MAPK and total p38 MAPK expression in MAP3K7 KD K562, TF1a, and K052 cells using two different negative control siRNAs (siCtrl-1/2) and three different siRNAs specific for MAP3K7. n ≥ 3 independent experiments. (Right) Bar graphs displaying the results of ImageJ-quantified, α-Tubulin–normalized band intensities and P values from t tests. (E) Representative western blot analysis of the effects on p-p38 MAPK and total p38 MAPK expression in three WT and three mutant K562 clones expressing HA-tagged MAP3K7. n ≥ 3 independent experiments. (F) Representative western blot analysis of the effects on phospho-NF-κB p65 (p-NF-κB p65), p-p38 MAPK and total p38 MAPK expression in MAP3K7 KD K562 and TF1a cells using negative control siRNA #1 and siMAP3K7 #2 (see D). Expression of p-NF-κB p65 in three mutant and three WT K562/SF3B1 is also shown. “Low” and “High” represent different exposures of the same gel. n = 3 independent experiments.

