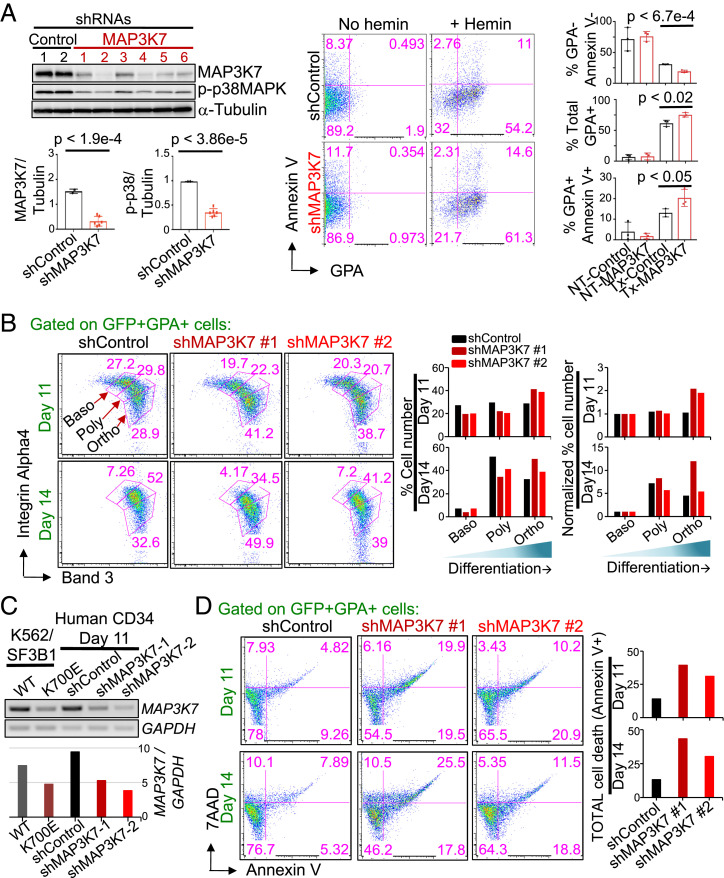
Fig. 4.
KD of MAP3K7 in parental K562 and normal human CD34+ cells causes increased erythroid differentiation and cell death. (A) Images (from Left to Right) of representative western blot analysis of GFP-sorted, shRNA-mediated MAP3K7 KD (two different negative control and six different MAP3K7 shRNAs) in parental K562 cells, representative two-color FACS plot of AnnexinV vs. GPA from a control and shMAP3K7, and bar graphs showing the averages and SDs of (from Top to Bottom) % GPA−Annexin− (undifferentiated cells), % total GPA+ (nonapoptotic erythroids), and % GPA+AnnexinV+ cells (apoptotic erythroids) after 3 d of treatment with 50 μM hemin from three independent experiments. Bar graphs displaying the results of ImageJ-quantified, α-Tubulin–normalized MAP3K7 and p-p38 band intensities in Western blot analysis are shown below the Western blot. P values from t tests are labeled on all bar graphs. (B) Representative FACS plots showing surface expression of Integrin α-4 and band 3 from day 11 and day 14 shRNA-mediated MAP3K7 KD (one negative control and two different MAP3K7 shRNAs) in human erythropoietin (EPO)-induced CD34+ cells that were CD45− and double-positive GFP+GPA+ (= erythroblasts cells). Erythroblast stages are depicted and labeled (Baso, basophilic normoblast; Poly, polychromatophilic normoblast; Ortho, othrochromatic normoblast). (Right) Bar graphs, quantifying the percentage of erythroblasts in each stage, are shown, as well as Baso-normalized percent erythroid cells for comparison. n = 2 independent experiments. (C) RT-PCR showing day 11 shRNA-mediated MAP3K7-KD expression in day 11 EPO-induced CD34+ cells. Abundance of GAPDH-normalized MAP3K7 expression is depicted in the bar graph below. (D) Representative FACS analysis of cell death via 7AAD and AnnexinV from (C) day 11 and day 14 MAP3K7 KD, human EPO-induced, CD45−GFP+GPA+ erythroblasts. Bar graphs, specifying the percentage of total erythroblast cell death, are shown. n = 2 independent experiments.

