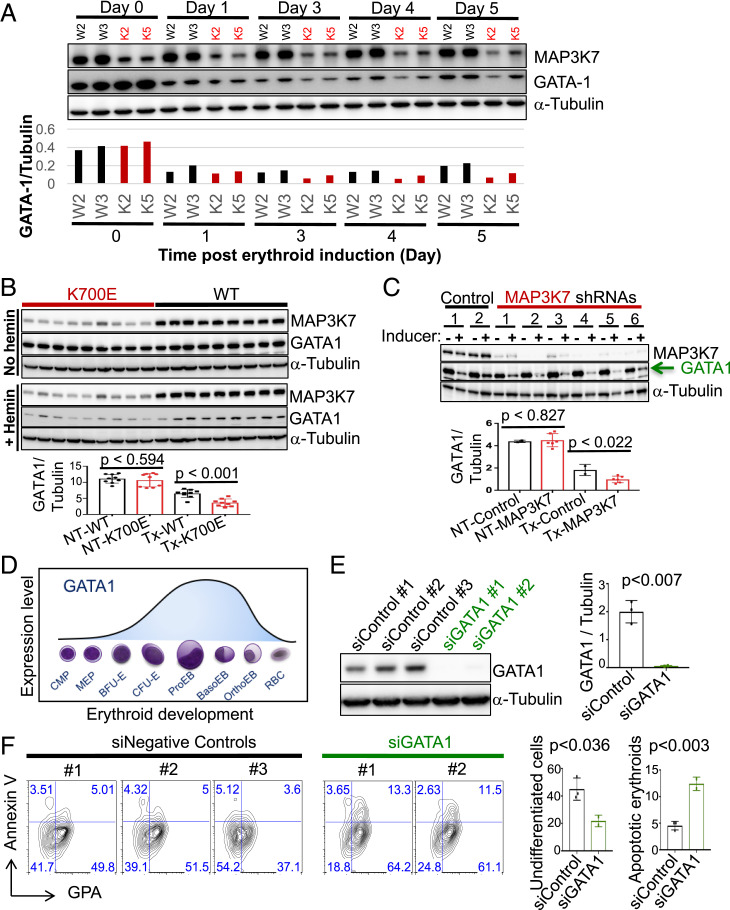
Fig. 5.
Premature down-regulation of GATA1 in differentiated K700E or MAP3K7 KD cells underlies the accelerated differentiation and erythroid cell death. (A) Western blot analysis (Upper) and quantifying bar graph (Lower) showing expression of GATA-1 during a 5-d time course of treatment with 50 μM hemin to induce erythroid differentiation in two representative K700E (K2 and K5) and two representative WT (W2 and W3) K562/SF3B1 clones. (B) Representative western blot images showing GATA-1 protein expression in the nine mutant and nine WT K562/SF3B1 clones that were treated or not with 50 μM hemin for 3 d. Bar graph displaying the results of ImageJ-quantified, α-Tubulin–normalized GATA-1 band intensity and P values from t tests. n = 4 independent experiments. (C) Representative western blot image of GATA-1 expression in shRNA-mediated MAP3K7 KD parental K562 cells that were treated or not with 50 μM hemin for 3 d. n = 3 independent experiments. (D) Illustration (adapted from ref. 32) showing GATA1 expression during the course of erythroid development from myeloid progenitor cell (CMP) to mature red blood cell (RBC). BasoEB, basophilic erythroblast/normoblast; BFU-E, Burst-forming unit-erythroid; CFU-(E) colony-forming unit-erythroid; MEP, megakaryocyte-erythroid progenitor; OrthoEB, orthochromatic erythroblast/normoblast; ProEB, Proerythroblast. (E) Western blot image showing GATA-1 KD (two different GATA-1 and three different negative control siRNAs) expression in parental K562 cells and (F) its effects on erythroid differentiation and erythroid apoptosis via FACS analysis of AnnexinV vs. GPA after 3 d of 50 μM hemin treatment. Bar graphs (Right) indicate percent undifferentiated cells (double-negative GPA−AnnexinV−) and percent apoptotic erythroid cells (double-positive GPA+AnnexinV+). P values from t tests are shown. n = 3 independent experiments. GPA positivity was gated based on unstained parental K562 cells.

