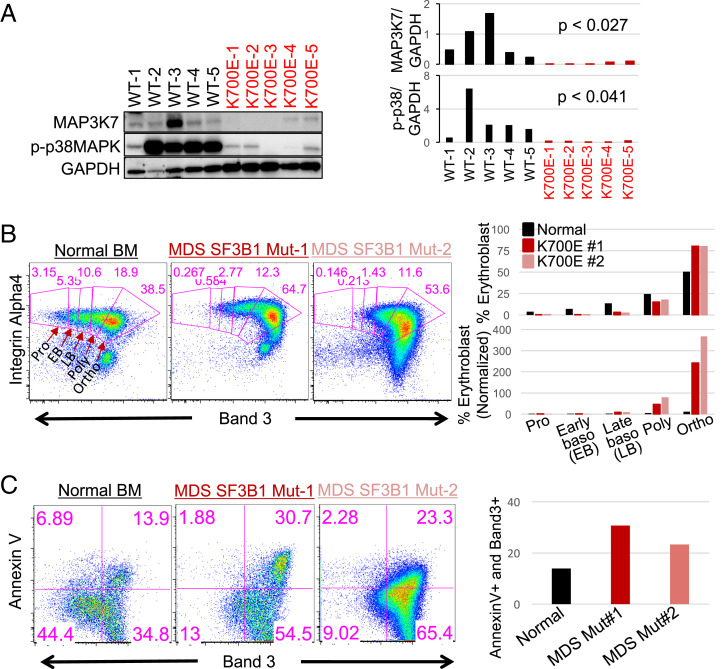
Fig. 6.
Mutant SF3B1 MDS patient cells display phenotypes observed in K562/SF3B1 mutant cells and MAP3K7 KD cells. (A) Western blot analysis showing MAP3K7 and p-p38 MAPK expression in MDS BM mononuclear cells from five patients with WT and five patients with K700E SF3B1 mutation. (Right) Bar graphs quantifying the results of western blots and P values from t tests are shown. (B) Representative FACS plots showing the erythroblast profiles of primary BM cells from SF3B1 K700E MDS patients and normal healthy individual. The isolated CD45− BM cells were stained with three erythroid markers: GPA, Integrin α-4, and band 3. FACS plot of Integrin α-4 vs. band 3 on GPA+ BM cells. Erythroblast stages are depicted and labeled. Bar graphs, quantifying the percentage of nucleated erythroblasts in each stage as a total of 100%, are shown as well as proerythroblast (Pro)-normalized percent erythroid cells for comparison. Three SF3B1 K700E MDS patients and three normal healthy individuals were profiled. EB, early basophilic erythroblasts; LB, late basophilic erythroblasts; Ortho, orthochromatic erythroblasts; Poly, polychromatic erythroblasts; Pro, proethroblasts. (C) Representative FACS analysis of erythroblast cell death via AnnexinV vs. band 3 from (B) Bar graph quantifies the percentage of late-stage erythroblast cell death (AnnexinV+Band3+).

