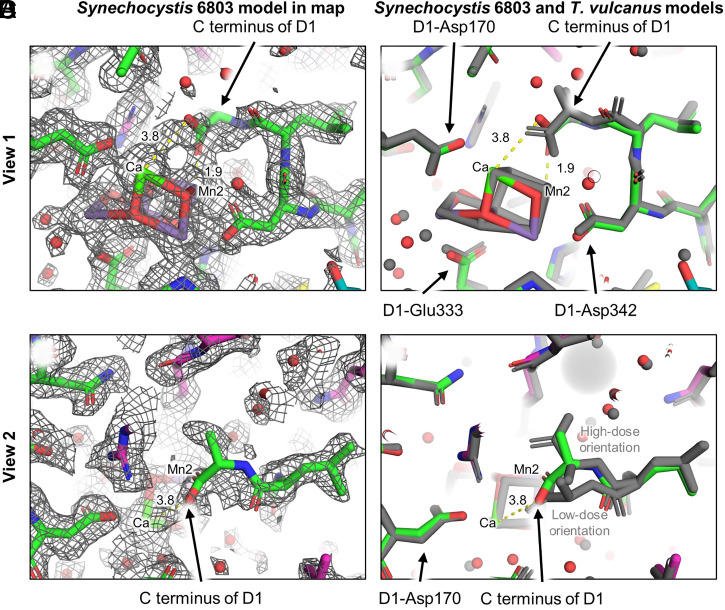
Fig. 3.
ESP map and structure comparison near the D1 C terminus. (A) View 1 of the Synechocystis 6803 PSII structure within the map showing ambiguity in the C terminus orientation. (B) View 1 showing the superposition of the Synechocystis 6803 PSII (colored) and T. vulcanus PSII (gray) cryo-EM structures. (C) View 2 of the Synechocystis 6803 PSII structure within the map showing ambiguity in the C terminus orientation. (D) View 2 showing the superposition of the Synechocystis 6803 PSII (colored) and T. vulcanus PSII cryo-EM structures (gray). Note that in the high-dose PSII cryo-EM structure from T. vulcanus, two orientations of the C terminus were modeled that were assigned as high-dose and low-dose orientations (20), which are labeled. Maps are shown at 7σ. Indicated distances are in units of angstrom.

