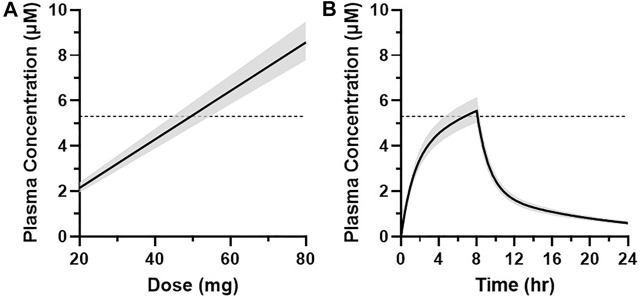
FIGURE 9.
(A) Graphical representation of the simulated plasma concentration (median ± 90% CI) at 7 h after the start of infusion at multiple dose levels in humans. (B) Simulated MK-2075 plasma concentration over time (median ± 90% CI) at a predicted dose of 50 mg infused intravenously over 8 h. Dashed horizontal line represents the target plasma concentration of 5.3 µM.

