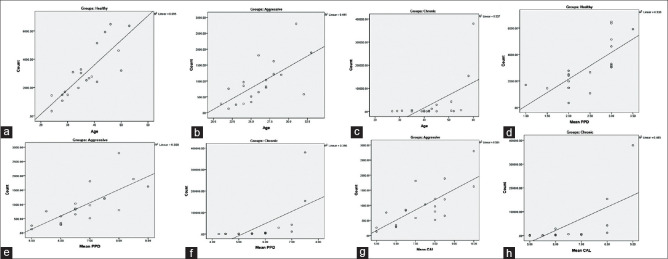
Figure 3.
The correlation between age and bacterial count in Group A, Group B, and Group C shows a linear increase in the count as age increases with a positive linear association of 0.695 (a), 0.441 (b), and 0.337 (c) respectively. The correlation between mean probing pocket depth and bacterial count in Group A, Group B, and Group C shows a linear increase in the count as mean probing pocket depth increases with a positive linear association of 0.538 (d), 0.568 (e), and 0.396 (f). The correlation between mean clinical attachment and bacterial count in Group B and Group C shows a linear increase in the count as mean clinical attachment increases with a positive linear association of 0.581 (g), and 0.465 (h) respectively

