
FIGURE 6.
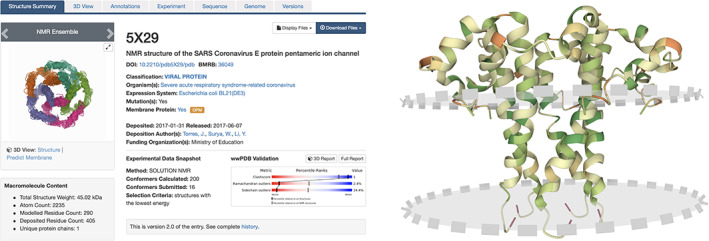
SSP for a SARS‐CoV E protein (PDB ID 5x29) 66 (left) with a view of the homopentamer looking down the molecular pore and Mol* visualization with predicted membrane location depicted using pink circles with dashed grey border (right). Each E protein monomer is shown in ribbon representation (color coded by hydrophobicity: dark green hydrophobic, dark red polar) and viewed nearly parallel to the plane of the membrane bilayer with the extracellular portion of each monomer in the upper portion of the image