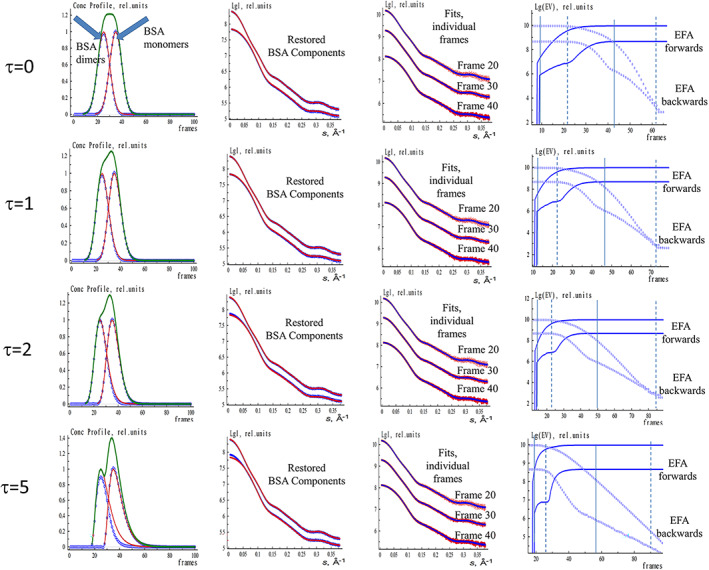
FIGURE 3.

EFAMIX deconvolution of synthetic SEC‐SAXS data from BSA monomer–dimer mixture (both components have equal fractions) with different concentration profile asymmetry (τ). The concentration profiles are modeled by EGH functions. The notations and color schemes are as in Figure 1. BSA, Bovine serum albumin; EFA, evolving factor analysis; EGH, exponential–Gaussian hybrid; SEC‐SAXS, size‐exclusion chromatography–small‐angle X‐ray scattering
