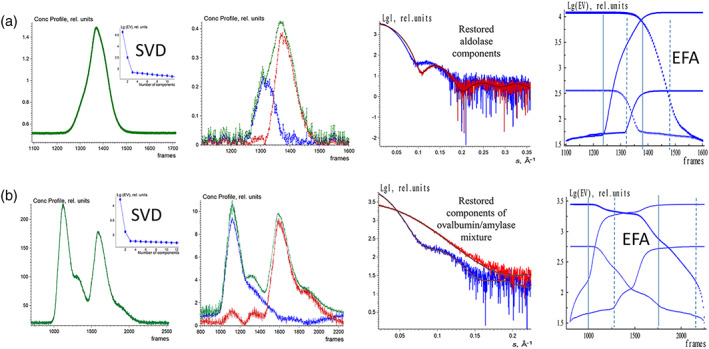
FIGURE 5.

EFAMIX deconvolution of experimental SEC‐SAXS data from aldolase (a) and the mixture of ovalbumin with β‐amylase (b); calculations were performed within a two‐component approximation. Column 1—Elution profiles of SEC‐SAXS data obtained by CHROMIXS (green). The insets contain the singular values of SVD decomposition of SEC‐SAXS data (after buffer subtraction) in descending order. Column 2—Restored concentration profiles of the components, the blue and red curves are individual components, and the green curve is the overall concentration profile. Column 3—Restored scattering profiles of the components and the fits (brown curves) from the crystallographic models (aldolase hexamer: 6R62.pdb; ovalbumin monomer: 1OVA.pdb; β‐amylase tetramer: 1FA2.pdb) to the restored scattering profiles by EFAMIX (blue and red, respectively). Column 4—Plots of the forward EFA (solid lines) and the backward EFA (circles) for which the notations and color schemes are the same as in Figure 1. EFA, evolving factor analysis; SEC‐SAXS, size‐exclusion chromatography–small‐angle X‐ray scattering; SVD, singular value decomposition
