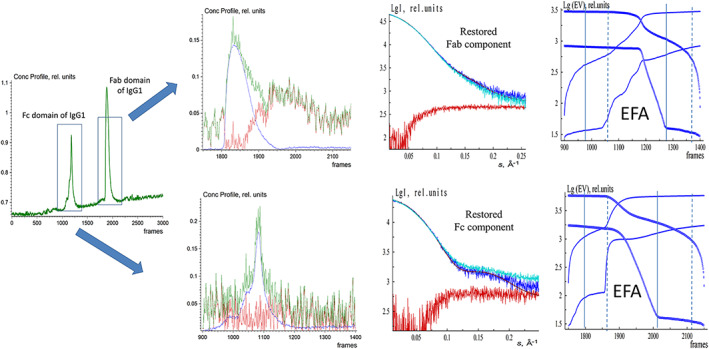
FIGURE 6.

EFAMIX deconvolution of experimental IEC‐SAXS data from Fc and Fab domains of IgG1. From left to right, Column 1—the elution profile of IEC‐SAXS data (green) obtained by CHROMIXS (the first elution peak corresponds to the Fc domain of IgG1, and the second elution peak belongs to the Fab domain of IgG1). Column 2—Restored concentration profiles of the components (Row 1 corresponds to the first elution peak from the Fc domain of IgG1 and Row 2 to the second elution peak from the Fab domain of IgG1), the blue and red curves are individual components, and the green curve is the overall concentration profile. Column 3—Restored scattering profiles of the components (blue and red, respectively), the fits (brown curves) from the Fc and Fab domains of IgG1 crystallographic structure (1HZH.pdb), and the comparison with the curve obtained by manual subtraction in CHROMIXS (cyan) using the buffer signals before and after the elution peak. Column 4—Plots of the forward EFA (solid lines) and the backward EFA (circles) for which the notations and color schemes are the same as in Figure 1. EFA, evolving factor analysis; Fab, fragment antigen‐binding; Fc, fragment crystallizable; IEC‐SAXS, ion‐exchange chromatography–small‐angle X‐ray scattering
