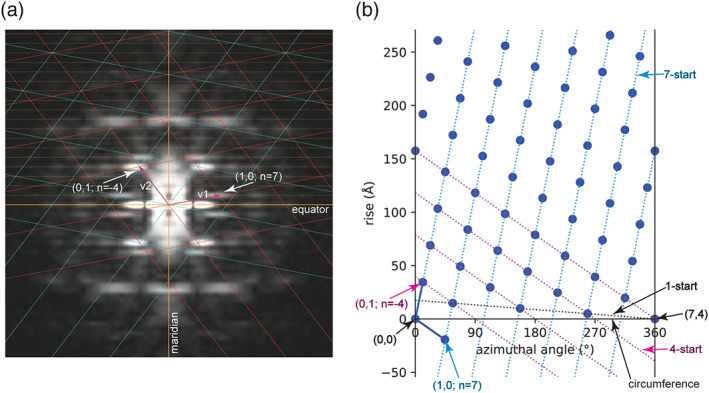
FIGURE 1.

Power spectrum and two‐dimensional (2D) lattices of a helical assembly. (a) A 2D lattice (red) consistent with peaks in the power spectrum is drawn based on the two unit vectors v1 (Bessel order 7) and v2 (Bessel order −4). The lattice in cyan is the mirror image of the red lattice. Layer lines are represented by dashed lines in orange. For simplicity, the bottom halves of the two lattices are not drawn to completion, because they are the mirror images of the top halves. Likewise, layer lines in the bottom half of the power spectrum are omitted. (b) Real space lattice generated from the Fourier space lattice in (a). The two blue solid lines are the two real space unit vectors. The first vector ends at the lattice point (1, 0), which specifies the spacing of the right‐handed seven‐start helical family (blue dashed lines), because the Bessel order of the Fourier space vector v1 is 7. The second vector ends at the lattice point (0, 1), which specifies the spacing of the left‐handed four‐start helical family (magenta dashed lines), because the Bessel order of the Fourier space vector v2 is −4. The circumferential vector of the helical assembly begins and ends at lattices points (0, 0) and (4, 7), respectively. The simplest description of the helical assembly is the one‐start helix indicated by the black dashed line. The rise (along the helical axis) and twist (azimuthal angle difference) between two consecutive lattice points in this one‐start helix are the required parameters for helical reconstruction with IHRSR
